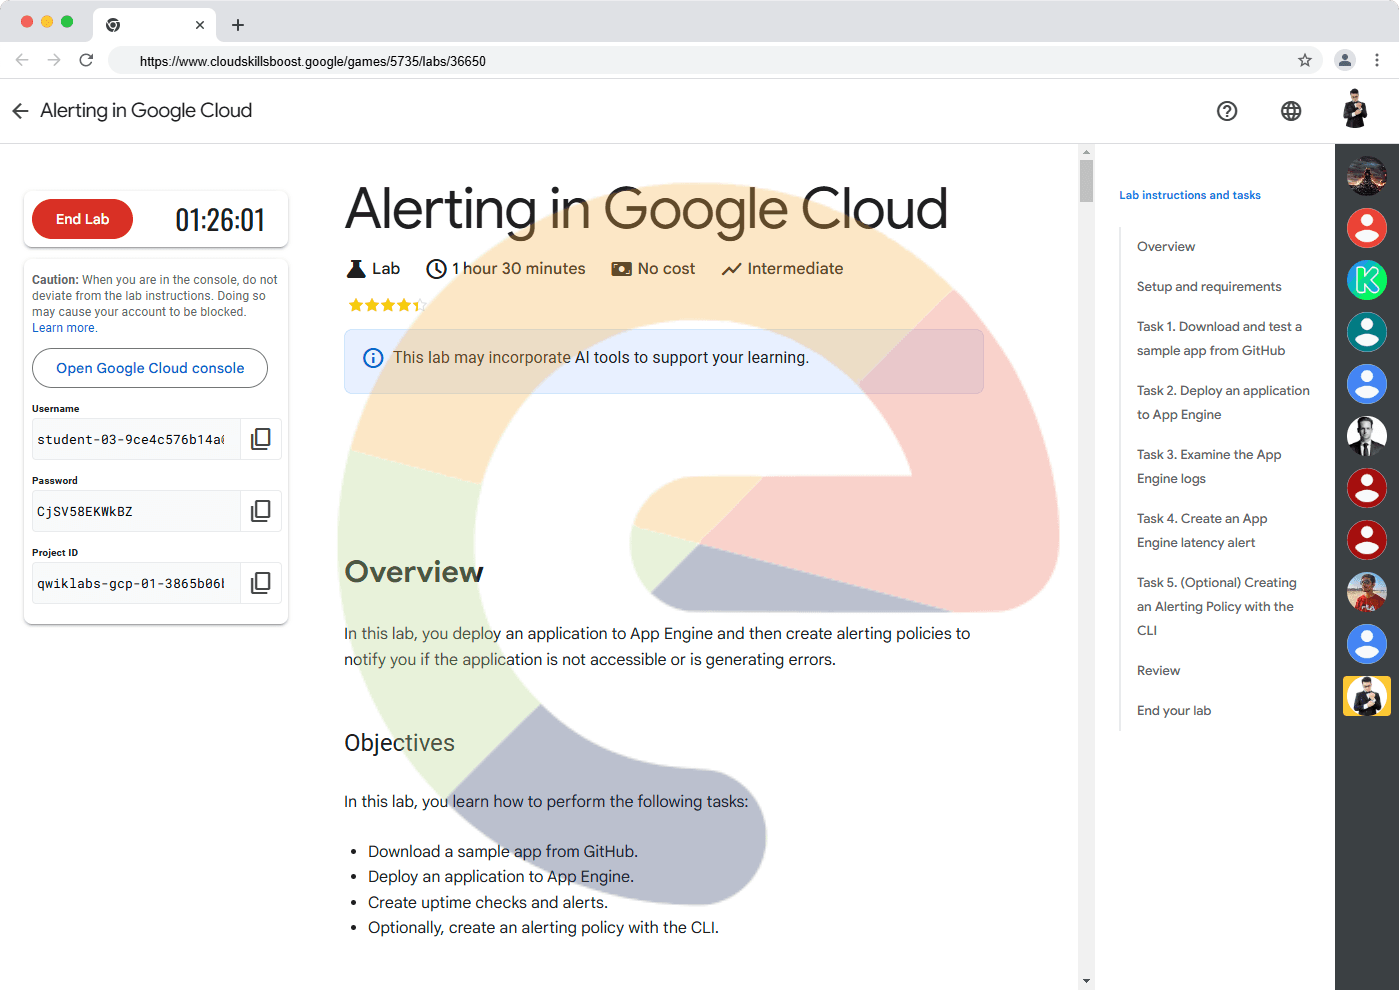
Alerting in Google Cloud (Solution)
A passionate full-stack developer from @ePlus.DEV
Overview
In this lab, you deploy an application to App Engine and then create alerting policies to notify you if the application is not accessible or is generating errors.
Objectives
In this lab, you learn how to perform the following tasks:
Download a sample app from GitHub.
Deploy an application to App Engine.
Create uptime checks and alerts.
Optionally, create an alerting policy with the CLI.
Setup and requirements
For each lab, you get a new Google Cloud project and set of resources for a fixed time at no cost.
Sign in to Qwiklabs using an incognito window.
Note the lab's access time (for example,
1:15:00), and make sure you can finish within that time.
There is no pause feature. You can restart if needed, but you have to start at the beginning.When ready, click Start lab.
Note your lab credentials (Username and Password). You will use them to sign in to the Google Cloud Console.
Click Open Google Console.
Click Use another account and copy/paste credentials for this lab into the prompts.
If you use other credentials, you'll receive errors or incur charges.Accept the terms and skip the recovery resource page.
After you complete the initial sign-in steps, the project dashboard appears.
Activate Google Cloud Shell
Google Cloud Shell is a virtual machine that is loaded with development tools. It offers a persistent 5GB home directory and runs on the Google Cloud.
Google Cloud Shell provides command-line access to your Google Cloud resources.
In Cloud console, on the top right toolbar, click the Open Cloud Shell button.
Click Continue.
It takes a few moments to provision and connect to the environment. When you are connected, you are already authenticated, and the project is set to your PROJECT_ID. For example:

gcloud is the command-line tool for Google Cloud. It comes pre-installed on Cloud Shell and supports tab-completion.
- You can list the active account name with this command:
gcloud auth list
Output:
Credentialed accounts:
 - @.com (active)
Example output:
Credentialed accounts:
 - google1623327_student@qwiklabs.net
- You can list the project ID with this command:
gcloud config list project
Output:
[core]
project =
Example output:
[core]
project = qwiklabs-gcp-44776a13dea667a6
Note: Full documentation of gcloud is available in the gcloud CLI overview guide .
Run the following commands to update the python environment
 python3 -m pip install --upgrade pip
 python3 -m venv myenv
 source myenv/bin/activate
Task 1. Download and test a sample app from GitHub
Clone the Google Training Data Analyst from GitHub into your Cloud Shell environment. The repo contains a simple application which is perfect for the requirements in this exercise.
git clone --depth 1 https://github.com/GoogleCloudPlatform/training-data-analyst.gitOnce the cloning completes, change to the
deploying-apps-to-gcpfolder in the repository that contains our sample app:cd ~/training-data-analyst/courses/design-process/deploying-apps-to-gcpOpen the
main.pyfile in the Cloud Shell editor. If prompted click Open in a new window. Take a moment to explore the basic "Hello GCP" Python Flask application.edit main.pyClose the editor and switch back to the Cloud Shell terminal. Click Open terminal at the top right to open the Terminal window. To test the program, load all of the Python application dependencies and then start the app.
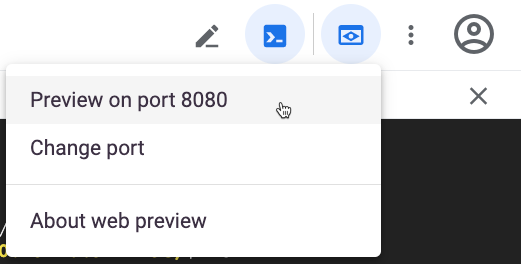
  pip3 install -r requirements.txt
  python3 main.py
To see the program running, click the Web Preview button in the toolbar of Cloud Shell, and then select Preview on port 8080.
The program should open a new browser tab and display the Hello GCP message.
- Close the tab and switch back to Cloud Shell, then press CTRL+C to exit the running Flask server.
Task 2. Deploy an application to App Engine
Now that we know the application works, let's deploy it to the App Engine.
Switch to (or reopen) the Cloud Shell code editor. Expand the
training-data-analyst/courses/design-process/deploying-apps-to-gcpfolder in the explorer tree on the left.From the File menu, select New File and name the file app.yaml.
Paste the following into the file you just created:
runtime: python312To make sure the file is saved, select File > Save.
Every project needs to first create an App Engine application before it can be used. This is done just once per project using the console, or the gcloud app create command. Either way, you need to specify the region where you want the app to be created.
Execute the following command in your Cloud Shell terminal. You may have to Authorize Cloud Shell to make such a change:
gcloud app create --region=us-west1Deploy the basic application to App Engine. The following command looks in the current directory for the application. It sees the app.yaml file declaring it a Python application and it assumes the rest of the folder contains the application itself, with a starting point in main.py. It loads the dependencies, packages the application, and deploys into the App Engine as a Service.
gcloud app deploy --version=one --quietWait for the application to finish deploying, then in the Google Cloud console window, use the Navigation menu () click on VIEW ALL PRODUCTS to navigate to Serverless > App Engine > Dashboard.
In the upper right of the dashboard, you see a link to your application similar to what is shown below.
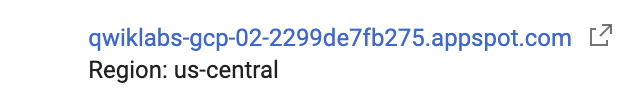
Note: By default, the URL to an App Engine is the form of https://project-id.wl.r.appspot.com.
Click the link to test your newly deployed app. It should function exactly like it did when we ran it in Cloud Shell.
Click refresh a number of times so Google Cloud can gather some sample data.
Click Check my progress to verify the objective.
Deploy an application to App Engine.
Check my progress
Task 3. Examine the App Engine logs
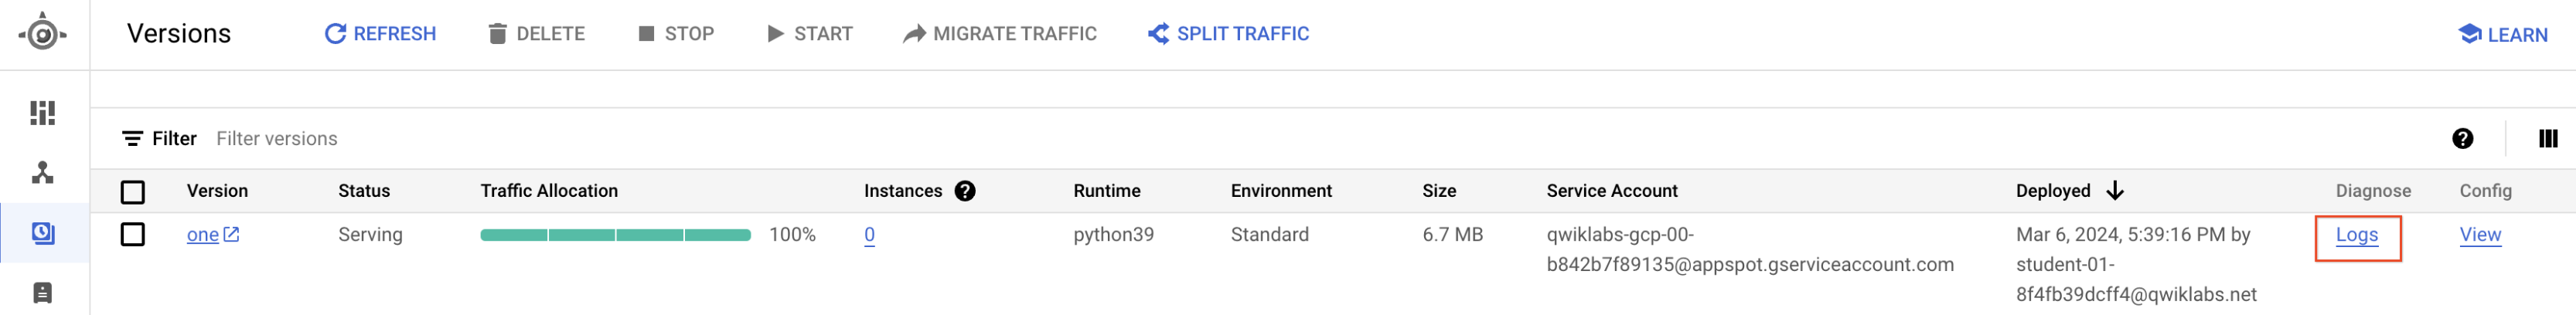
Switch back to the Console and on the left side under
App Engine, click the Versions link.Select Logs from the
Diagnosecolumn.
- In the logs, you see the requests you just made. If you get here too fast, wait a few seconds and click the Jump to Now button.
Task 4. Create an App Engine latency alert
Now that we have the application running, let's create an alert to watch for unusually high latency. To start, let's explore our application's current latency.
Check current application latency in Metrics explorer
In the Google Cloud console, use the Navigation menu click on VIEW ALL PRODUCTS to navigate to Observability > Monitoring > Metrics explorer.
Click on Select a metric drop-down and uncheck the Active option.
Set the
Metricto GAE Application > Http > Response latency. Click Apply. Make sure the metric is an App Engine metric, and not an uptime check metric. Because we don't currently have an uptime check, the second option won't work.In the Aggregation field click on the dropdown and select 99th percentile.
Take a moment and examine the chart.
We don't have a lot of data but we should have enough to display a chart line showing us the average time it took our application to return a response to the fastest 99% of requests, cutting off 1% of anomalies.
Create an alert based on the same metric
Our application is performing as expected now. There may have been a few slow responses when the application was first launched, but on average, you should be seeing response times under 200ms.
Let's create an alert to notify us if we have response times over 5s for more than a minute.
Use the Navigation menu click on VIEW ALL PRODUCTS to navigate to Observability > Monitoring > Alerting.
At the top, click Edit Notification Channels and scroll to the Email section. Use Add New to add your email address as a valid notification channel. For
Display name, choose any name and then click SAVE.Switch back to the main Alerting page and click Create Policy.
Click Select a metric and uncheck the Active option to display the same metric explorer page. Once again, set the
Metricto GAE Application > Http > Response latency. Click Apply. Set rolling window to1 minand then click Next.
You'll notice the new Configuration section that's been added to the standard Metrics explorer window in the lower left.
Set up a condition so that if Any time series violates the
Threshold postionis above andThreshold valueto 8000ms, it should trigger an alert.Set the
condition nameto Response latency [MEAN] for 99th% over 8s.Take a moment to examine the alert's chart. It's the same chart we created earlier with the Metrics explorer, but this time there should be an alert line drawn at 8s.
Click Next.
For
Notifications and name, expand theNotification Channeland check yourself, click OK (the notification channel you created earlier in this section).Name the alert Hello too slow and click Next. Review alert and click Create Policy.
Update the application code to add a delay. Return to the Cloud Shell code editor. Expand the training-data-analyst/courses/design-process/deploying-apps-to-gcp folder in the explorer tree on the left.
Click
main.pyto open it in the editor. Near the top at line 2, add the following imports statements (some will be used later in the exercise):import time import random import jsonReplace the current
main()function with the one below. This new version adds a sleep command which pauses the code for 10s in the middle of each request. This will be well over the threshold.@app.route("/") def main(): model = {"title": "Hello GCP."} time.sleep(10) return render_template('index.html', model=model)Now re-deploy your application by rerunning:
gcloud app deploy --version=two --quietWait for the command to finish the re-deployment.
After the command completes, return to the App Engine > Dashboard and make sure the link works.
To generate some consistent load, in Cloud Shell, enter the following command:
while true; do curl -s https://$DEVSHELL_PROJECT_ID.appspot.com/ | grep -e "<title>" -e "error";sleep .$[( $RANDOM % 10 )]s;done
Note: This command makes requests to the App Engine app continuously in a loop. The grep command will display the title of the page when the request works. It also displays the error, if it doesn’t work. Every iteration, the thread sleeps a random amount of time less than a second, but with the 10s response time delay it will seem much longer.
Wait and after a few minutes (typically about 5), you should receive an email notifying you of the alert. When you do, switch back to the Cloud Shell terminal and use CTRL+C to stop the load tester loop.
Use the Navigation menu click on VIEW ALL PRODUCTS to view the Observability > Monitoring > Alerting page in the Google Cloud Console.
Notice the firing alert and how it created an incident.
Click the incident to view details.
Investigate the details page, scroll to the top and select Acknowledge Incident.
Switch back to the main Alerting page and notice the changes.
Click Check my progress to verify the objective.
Create an App Engine latency alert.
Check my progress
Task 5. (Optional) Creating an Alerting Policy with the CLI
The Alerting CLI (and API) can be very effective when applying alerting policies with code or scripts.
Return to the Cloud Shell code editor. Select the training-data-analyst/courses/design-process/deploying-apps-to-gcp folder in the explorer tree on the left.
From the File menu, select New File and name the file app-engine-error-percent-policy.json.
Create an alerting policy which divides the number of 500 errors by the total number of responses, then triggers when the 500 errors exceed 1 percent. Paste the following into the file you just created:
{
    "displayName": "HTTP error count exceeds 1 percent for App Engine apps",
    "combiner": "OR",
    "conditions": [
        {
            "displayName": "Ratio: HTTP 500s error-response counts / All HTTP response counts",
            "conditionThreshold": {
                 "filter": "metric.label.response_code>=\"500\" AND metric.label.response_code<\"600\" AND metric.type=\"appengine.googleapis.com/http/server/response_count\" AND resource.type=\"gae_app\"",
                 "aggregations": [
                    {
                        "alignmentPeriod": "60s",
                        "crossSeriesReducer": "REDUCE_SUM",
                        "groupByFields": [
                          "project",
                          "resource.label.module_id",
                          "resource.label.version_id"
                        ],
                        "perSeriesAligner": "ALIGN_DELTA"
                    }
                ],
                "denominatorFilter": "metric.type=\"appengine.googleapis.com/http/server/response_count\" AND resource.type=\"gae_app\"",
                "denominatorAggregations": [
                   {
                      "alignmentPeriod": "60s",
                      "crossSeriesReducer": "REDUCE_SUM",
                      "groupByFields": [
                        "project",
                        "resource.label.module_id",
                        "resource.label.version_id"
                       ],
                      "perSeriesAligner": "ALIGN_DELTA"
                    }
                ],
                "comparison": "COMPARISON_GT",
                "thresholdValue": 0.01,
                "duration": "0s",
                "trigger": {
                    "count": 1
                }
            }
        }
    ]
}
Save your file. Make sure you are in the correct folder and that your alerting policy was saved there.
 cd ~/training-data-analyst/courses/design-process/deploying-apps-to-gcp
 ls
Deploy the alerting policy with the following command:
gcloud alpha monitoring policies create --policy-from-file="app-engine-error-percent-policy.json"Back in the Google Cloud console, return to the Observability > Monitoring > Alerting page. In the Policies section, you should see the alerting policy you just deployed.
Click your HTTP error… policy to see its details. Edit the notification channel so you receive an email when the alert fires.
Deploy the App Engine app with a random error to test this policy. Return to the Cloud Shell code editor. Expand the training-data-analyst/courses/design-process/deploying-apps-to-gcp folder in the explorer tree on the left.
Open the
main.pyfile in the Cloud Shell editor.Replace the current
main()function with the one below. This new function removes our sleep command and uses the random number generator to return a 500 error about 2% of the time. This should be enough to cause your HTTP error count policy to trigger.
@app.route("/")
def main():
    num = random.randrange(49)
    if num == 0:
        return json.dumps({"error": 'Error thrown randomly'}), 500
    else:
        model = {"title": "Hello GCP."}
        return render_template('index.html', model=model)
Redeploy your application with the following command:
gcloud app deploy --version=two --quietWait for the command to finish the redeployment.
After the command completes, return to the App Engine > Dashboard and make sure the link works.
In Cloud Shell, rerun the load generator command from earlier:
while true; do curl -s https://$DEVSHELL_PROJECT_ID.appspot.com/ | grep -e "<title>" -e "error";sleep .$[( $RANDOM % 10 )]s;done
In Cloud Shell, you should see an error appear randomly about 2% of the time. Leave the command running.
In the console, go to Observability > Monitoring > Alerting, wait another few minutes, and then you should see an alerting incident fire. You should also get an email. This won’t happen immediately, you have to be patient.
Once you get the email and see the incident fire, go back to Cloud Shell and press CTRL+C to stop the requests.
If you wait a couple more minutes, you see the incident resolve itself and get another email.
To make sure you don’t get any emails after the project is deleted, delete your notification channels. Click the HTTP error count… policy to see its details. Click the Edit link, expand the Notification Channel and uncheck yourself. Toggle off
Use notification channel. Save your changes and then Delete the policy.Repeat the previous step to your Uptime check alerting policy.
Review
In this exercise, you used the Google Cloud Console and CLI to create and test alerting policies. Good job!
Solution of Lab
curl -LO raw.githubusercontent.com/QUICK-GCP-LAB/2-Minutes-Labs-Solutions/refs/heads/main/Alerting%20in%20Google%20Cloud/shell.sh
sudo chmod +x *.sh
./shell.sh