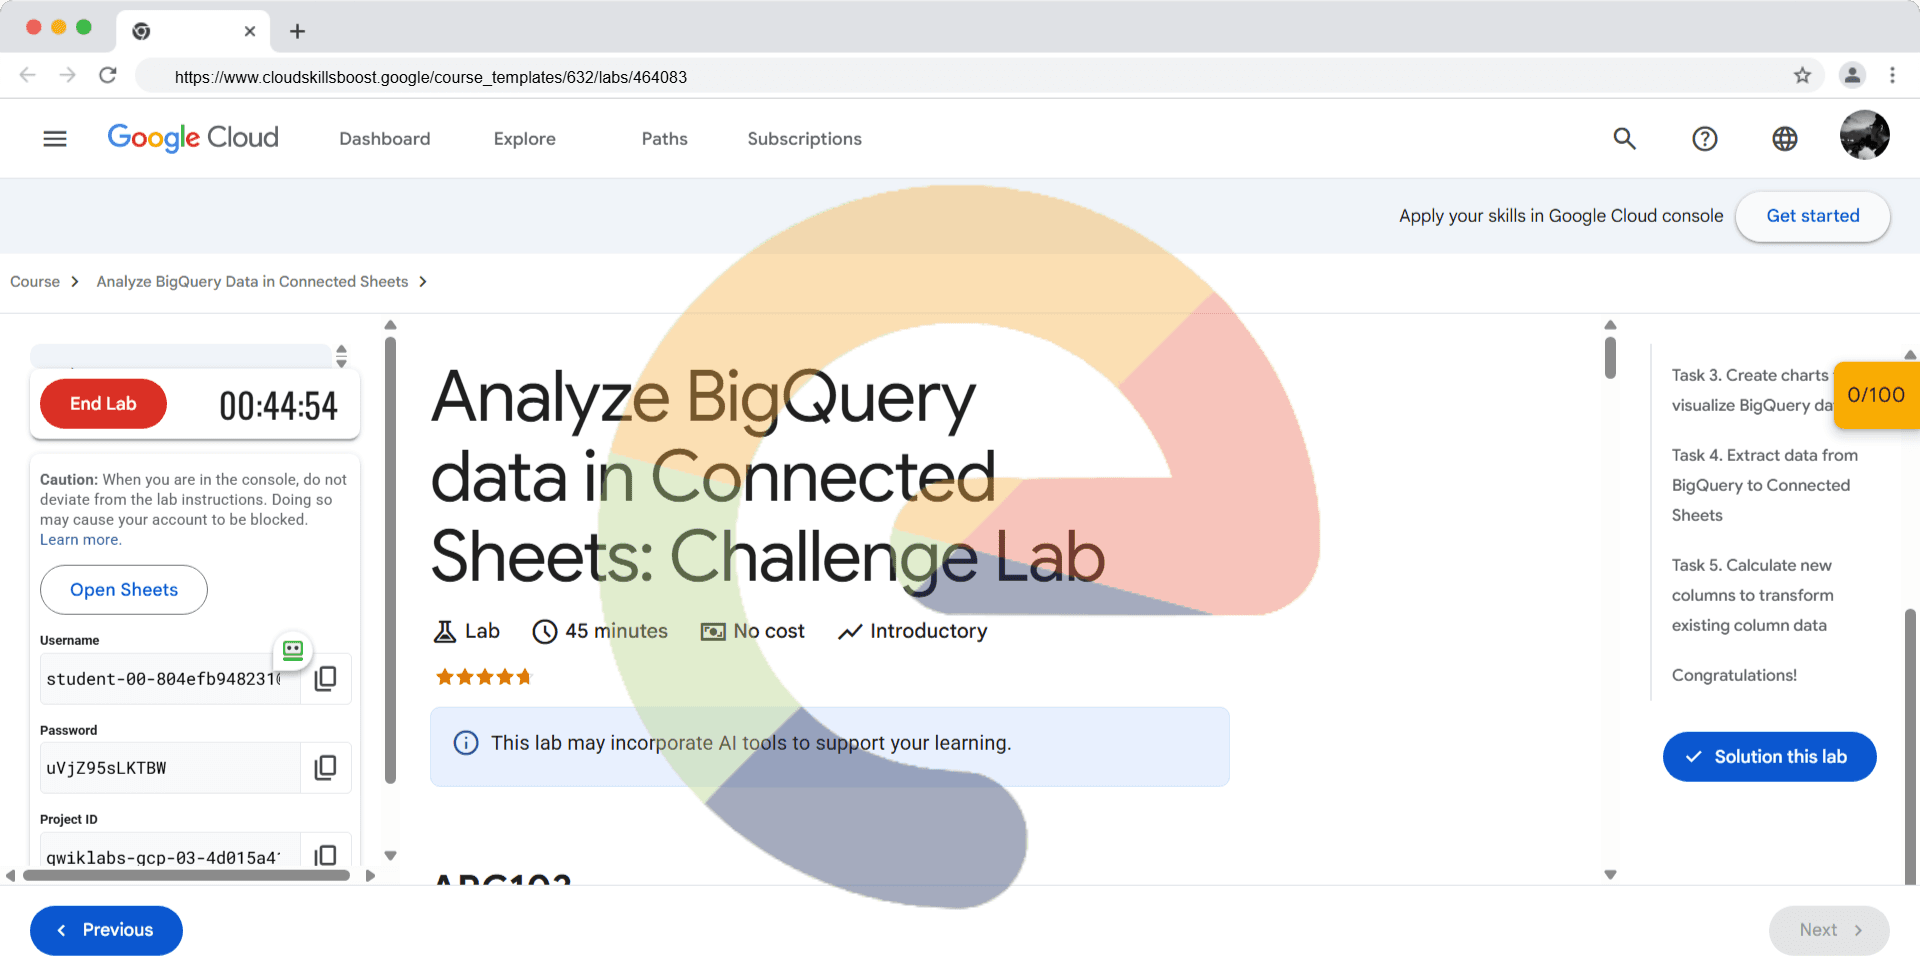
Analyze BigQuery data in Connected Sheets: Challenge Lab - ARC103
A passionate full-stack developer from @ePlus.DEV
Overview
In a challenge lab you’re given a scenario and a set of tasks. Instead of following step-by-step instructions, you will use the skills learned from the labs in the course to figure out how to complete the tasks on your own! An automated scoring system (shown on this page) will provide feedback on whether you have completed your tasks correctly.
When you take a challenge lab, you will not be taught new Google Cloud concepts. You are expected to extend your learned skills, like changing default values and reading and researching error messages to fix your own mistakes.
To score 100% you must successfully complete all tasks within the time period!
Setup
Before you click the Start Lab button
Read these instructions. Labs are timed and you cannot pause them. The timer, which starts when you click Start Lab, shows how long Google Cloud resources will be made available to you.
This hands-on lab lets you do the lab activities yourself in a real cloud environment, not in a simulation or demo environment. It does so by giving you new, temporary credentials that you use to sign in and access Google Cloud for the duration of the lab.
To complete this lab, you need:
- Access to a standard internet browser (Chrome browser recommended).
Note: Use an Incognito or private browser window to run this lab. This prevents any conflicts between your personal account and the Student account, which may cause extra charges incurred to your personal account.
- Time to complete the lab---remember, once you start, you cannot pause a lab.
Note: If you already have your own personal Google Cloud account or project, do not use it for this lab to avoid extra charges to your account.
Challenge scenario
You are just starting your junior data analyst role. So far you have been helping teams create and manage Google Sheets and data resources.
You are expected to have the skills and knowledge for these tasks.
Your challenge
You are asked to help a newly formed development team with some of their initial work on a new project around analyzing taxi data in New York City. You have been asked to assist the Taxi team with their analysis using Google Sheets; you receive the following request to complete the following tasks:
Connect a BigQuery dataset to Google Sheets.
Use a formula to find the number of taxi trips that include an airport fee.
Create a chart of the percentages of all payment types.
Extract raw data from BigQuery to Connected Sheets.
Calculate a column to create a new column from transformations/combinations of existing columns.
Each task is described in detail below, good luck!
Task 1. Open Google Sheets and connect to a BigQuery dataset
- Log in to Sheets using the credentials provided, and connect to
qwiklabs-gcp-00-04f45539533b> Public datasets > new_york_taxi_trips > tlc_yellow_trips_2022.
Task 2. Use a formula to count rows that meet a specific criteria
- Use a formula to count the number of taxi trips that include an airport fee.
Click Check my progress to verify the objective.
Use formulas in Connected Sheets
Check my progress
Task 3. Create charts to visualize BigQuery data
- Create a pie chart to identify which payment type is most frequently used to pay the fare amount.
| Payment type code | Payment type description |
| 1 | Credit Card |
| 2 | Cash |
| 3 | No charge |
| 4 | Dispute |
| 5 | Unknown |
| 6 | Voided trip |
Click Check my progress to verify the objective.
Use charts in Connected Sheets
Check my progress
Task 4. Extract data from BigQuery to Connected Sheets
- Extract 10,000 rows of data from the columns pickup_datetime, dropoff_datetime, trip_distance, and fare_amount, ordered by longest trip first.
Click Check my progress to verify the objective.
Extract BigQuery data in Connected Sheets
Check my progress
Task 5. Calculate new columns to transform existing column data
- Calculate a new column that displays the percentage of each fare amount that was used to pay toll fees (based on the toll_amount column).
Click Check my progress to verify the objective.
Calculate columns in Connected Sheets
Solution of Lab
Task 1

Task 2
=COUNTIF(tlc_yellow_trips_2022!airport_fee, "1")

Task 3

Task 4

Task 5
=IF(fare_amount>0,tip_amount/fare_amount*100,0)