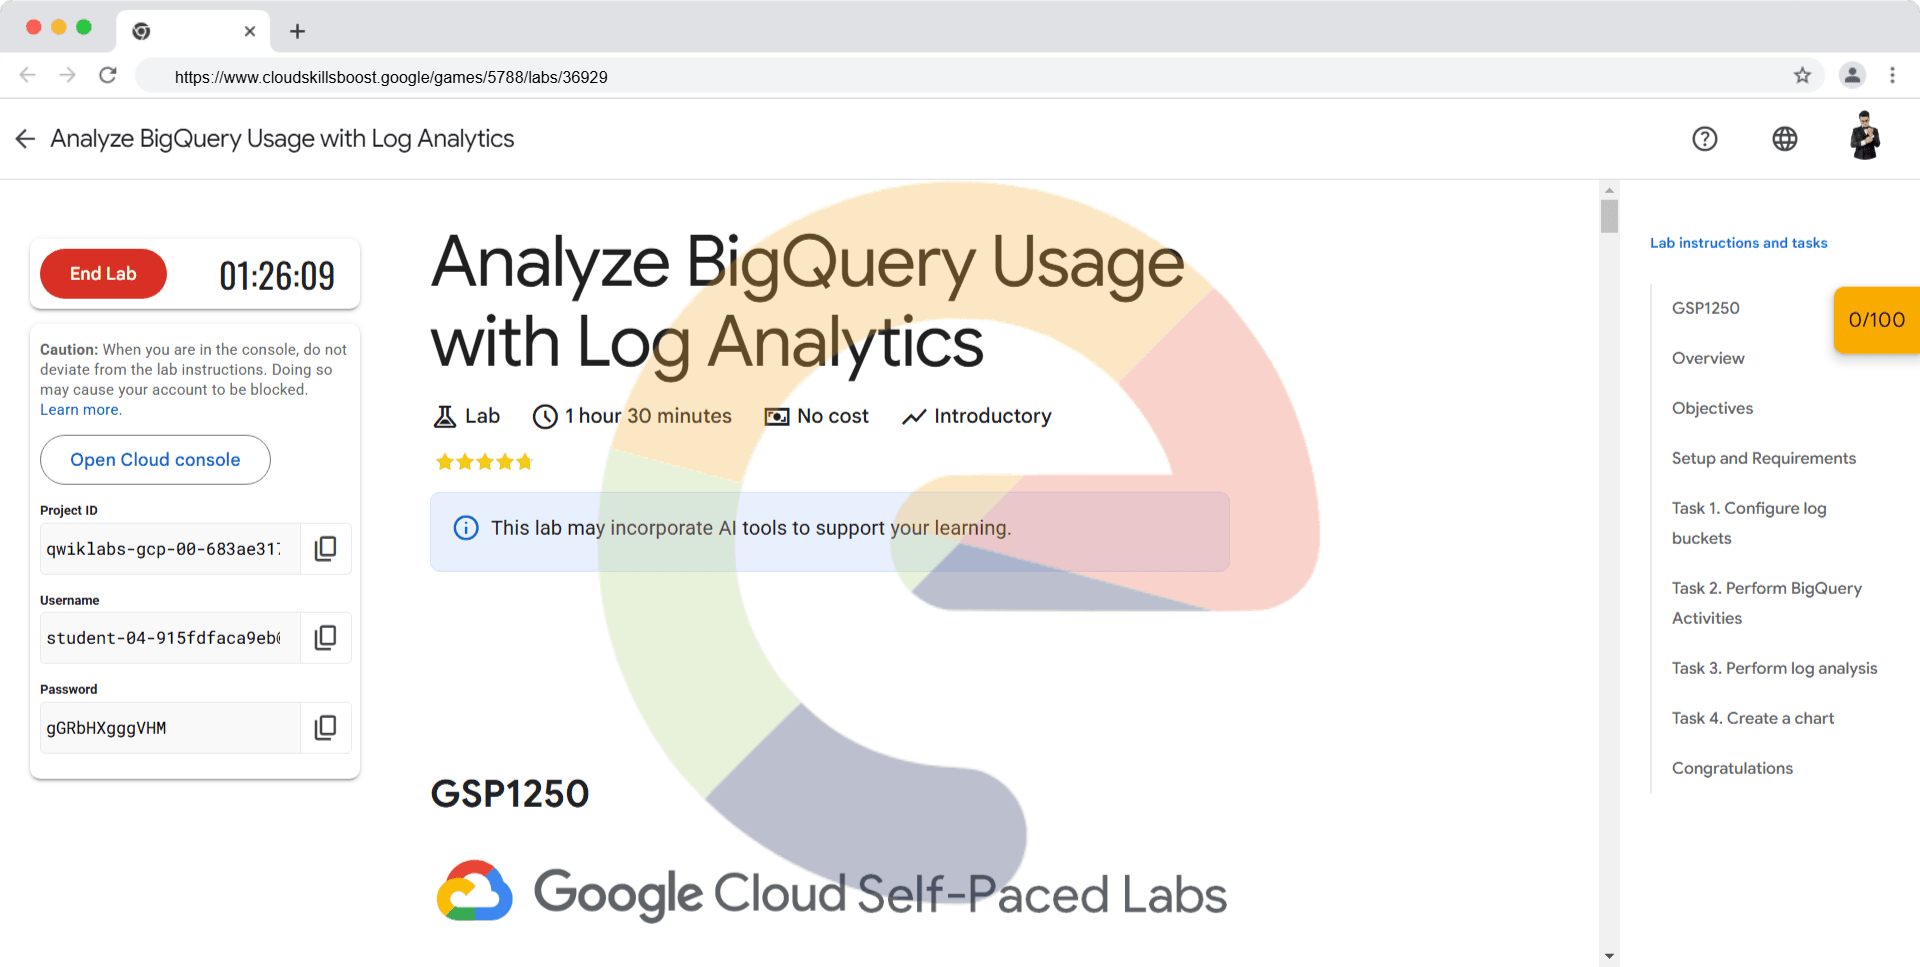
Analyze BigQuery Usage with Log Analytics - GSP1250
A passionate full-stack developer from @ePlus.DEV
Overview
While BigQuery offers built-in observability capabilities like the INFORMATION_SCHEMA views, detailed logging remains crucial for in-depth usage analysis, auditing, and troubleshooting potential issues. Enabling Log Analytics lets you query and analyze your log data using familiar SQL queries, then view or chart the query results.
BigQuery is Google Cloud's fully managed enterprise data warehouse that helps you manage and analyze your data with built-in features like machine learning, geospatial analysis, and business intelligence.
In this lab you will enable Log Analytics on Logs Storage buckets, then view the BigQuery logs inside Cloud Logging, and use SQL to analyze the logs using Log Analytics.
Objectives
In this lab you will learn how to:
Use Cloud Logging effectively to get insight about BigQuery usage
Effectively build and run SQL queries using Log Analytics
View and chart the results
Setup and Requirements
Before you click the Start Lab button
Read these instructions. Labs are timed and you cannot pause them. The timer, which starts when you click Start Lab, shows how long Google Cloud resources are made available to you.
This hands-on lab lets you do the lab activities in a real cloud environment, not in a simulation or demo environment. It does so by giving you new, temporary credentials you use to sign in and access Google Cloud for the duration of the lab.
To complete this lab, you need:
- Access to a standard internet browser (Chrome browser recommended).
Note: Use an Incognito (recommended) or private browser window to run this lab. This prevents conflicts between your personal account and the student account, which may cause extra charges incurred to your personal account.
- Time to complete the lab—remember, once you start, you cannot pause a lab.
Note: Use only the student account for this lab. If you use a different Google Cloud account, you may incur charges to that account.
How to start your lab and sign in to the Google Cloud console
Click the Start Lab button. If you need to pay for the lab, a dialog opens for you to select your payment method. On the left is the Lab Details pane with the following:
The Open Google Cloud console button
Time remaining
The temporary credentials that you must use for this lab
Other information, if needed, to step through this lab
Click Open Google Cloud console (or right-click and select Open Link in Incognito Window if you are running the Chrome browser).
The lab spins up resources, and then opens another tab that shows the Sign in page.
Tip: Arrange the tabs in separate windows, side-by-side.
Note: If you see the Choose an account dialog, click Use Another Account.
If necessary, copy the Username below and paste it into the Sign in dialog.
student-04-915fdfaca9eb@qwiklabs.netYou can also find the Username in the Lab Details pane.
Click Next.
Copy the Password below and paste it into the Welcome dialog.
gGRbHXgggVHMYou can also find the Password in the Lab Details pane.
Click Next.
Important: You must use the credentials the lab provides you. Do not use your Google Cloud account credentials.
Note: Using your own Google Cloud account for this lab may incur extra charges.
Click through the subsequent pages:
Accept the terms and conditions.
Do not add recovery options or two-factor authentication (because this is a temporary account).
Do not sign up for free trials.
After a few moments, the Google Cloud console opens in this tab.
Note: To access Google Cloud products and services, click the Navigation menu or type the service or product name in the Search field.

Activate Cloud Shell
Cloud Shell is a virtual machine that is loaded with development tools. It offers a persistent 5GB home directory and runs on the Google Cloud. Cloud Shell provides command-line access to your Google Cloud resources.
Click Activate Cloud Shell at the top of the Google Cloud console.
Click through the following windows:
Continue through the Cloud Shell information window.
Authorize Cloud Shell to use your credentials to make Google Cloud API calls.
When you are connected, you are already authenticated, and the project is set to your Project_ID, qwiklabs-gcp-00-683ae317382f. The output contains a line that declares the Project_ID for this session:
Your Cloud Platform project in this session is set to qwiklabs-gcp-00-683ae317382f
gcloud is the command-line tool for Google Cloud. It comes pre-installed on Cloud Shell and supports tab-completion.
- (Optional) You can list the active account name with this command:
gcloud auth list
- Click Authorize.
Output:
ACTIVE: *
ACCOUNT: student-04-915fdfaca9eb@qwiklabs.net

To set the active account, run:
    $ gcloud config set account `ACCOUNT`
- (Optional) You can list the project ID with this command:
gcloud config list project
Output:
[core]
project = qwiklabs-gcp-00-683ae317382f
Note: For full documentation of gcloud, in Google Cloud, refer to the gcloud CLI overview guide.
Task 1. Configure log buckets
Upgrade log bucket
You will configure Cloud Logging to upgrade all the existing log buckets with Log Analytics enabled.
To upgrade existing buckets to use Log Analytics:
From the navigation menu, select Logging, and then select Logs Storage:
Select the bucket _Required.
When the Log Analytics available column displays Upgrade, you can upgrade the log bucket to use Log Analytics. Click Upgrade.
Click Confirm.
Repeat the same steps for the log bucket _Default.
Click Check my progress to verify the objective.
Upgrade the log buckets.
Check my progress
Task 2. Perform BigQuery Activities
Complete the following tasks to generate some BigQuery logs. In the tasks, the BigQuery command line tool bq is used.
- Use the
bq mkcommand to create new datasets named bq_logs and bq_logs_test in your project:
bq mk bq_logs
bq mk bq_logs_test
- Use the
bq lscommand to list the datasets:
bq ls
- Use the
bq rmcommand to delete the a dataset (select y when prompted):
bq rm bq_logs_test
- Create a new table:
bq mk \
 --table \
 --expiration 3600 \
 --description "This is a test table" \
 bq_logs.test_table \
 id:STRING,name:STRING,address:STRING
You should see a success message that a new empty table named test_table has been created for your dataset.
Now you'll run some queries to generate logs.
- Run the following query in Cloud Shell:
bq query --use_legacy_sql=false 'SELECT current_date'
- Copy the following command into Cloud Shell and press Enter:
bq query --use_legacy_sql=false \
'SELECT
 gsod2021.date,
 stations.usaf,
 stations.wban,
 stations.name,
 stations.country,
 stations.state,
 stations.lat,
 stations.lon,
 stations.elev,
 gsod2021.temp,
 gsod2021.max,
 gsod2021.min,
 gsod2021.mxpsd,
 gsod2021.gust,
 gsod2021.fog,
 gsod2021.hail
FROM
 `bigquery-public-data.noaa_gsod.gsod2021` gsod2021
INNER JOIN
 `bigquery-public-data.noaa_gsod.stations` stations
ON
 gsod2021.stn = stations.usaf
 AND gsod2021.wban = stations.wban
WHERE
 stations.country = "US"
 AND gsod2021.date = "2021-12-15"
 AND stations.state IS NOT NULL
 AND gsod2021.max != 9999.9
ORDER BY
 gsod2021.min;'
(This query uses weather data from the National Oceanic and Atmospheric Administration (NOAA))
Click Check my progress to verify the objective.
Perform BigQuery Activities.
Check my progress
Task 3. Perform log analysis
One common task when analyzing BigQuery usage is to search specific operations for your datasets. For each query you run, remember to replace [Your Project Id] with the project id provisioned for this lab.
- In the left navigation, under Logging, click Log Analytics to access the feature. You should see something like the following:
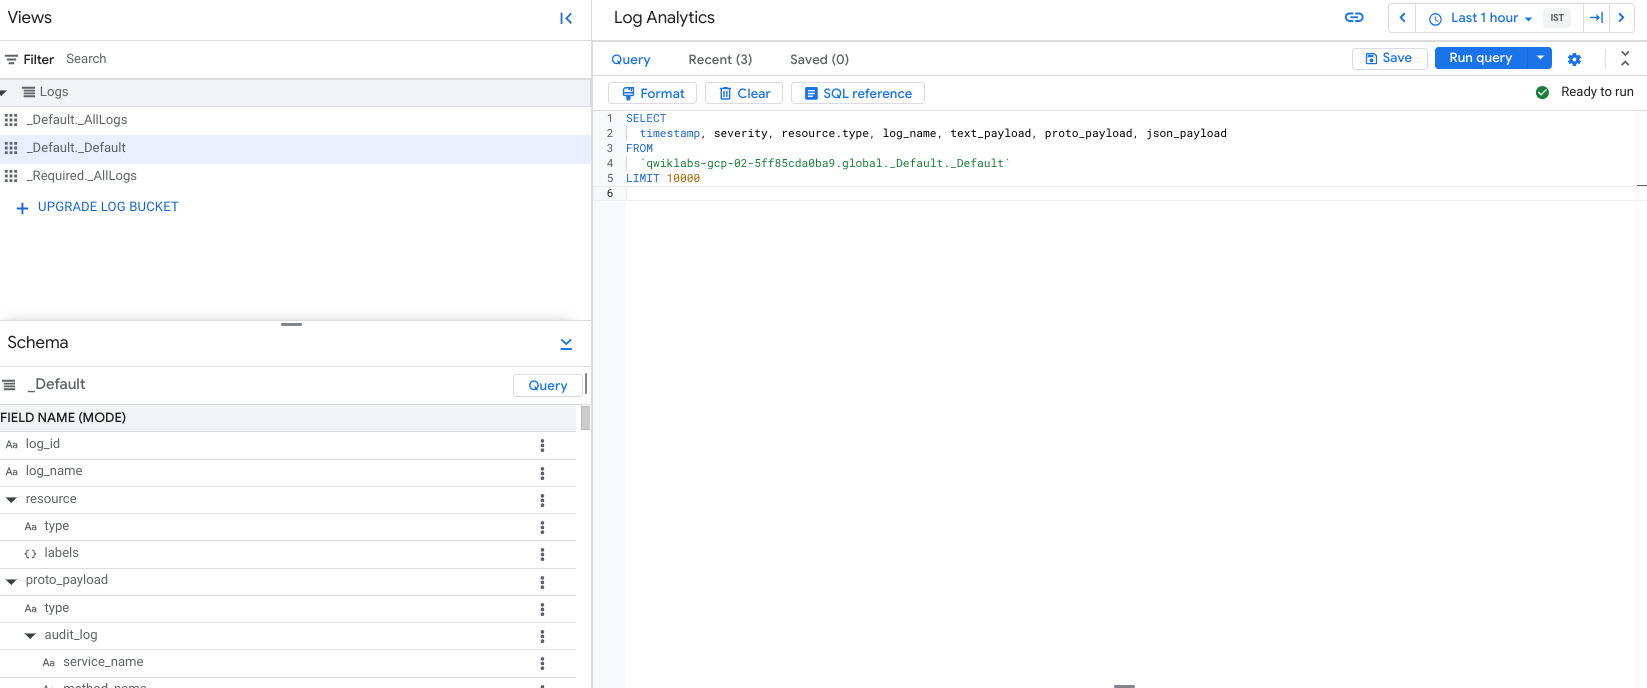
If your query field is empty or you forget which table you want to use, you can click the Query button to get the sample query back.
- To find operations such as created or deleted, run the following query:
SELECT
 timestamp,
 severity,
 resource.type,
 proto_payload.audit_log.authentication_info.principal_email,
 proto_payload.audit_log.method_name,
 proto_payload.audit_log.resource_name,
FROM
 `[Your Project Id].global._Required._AllLogs`
WHERE
 log_id = 'cloudaudit.googleapis.com/activity'
 AND proto_payload.audit_log.method_name LIKE 'datasetservice%'
LIMIT
 100
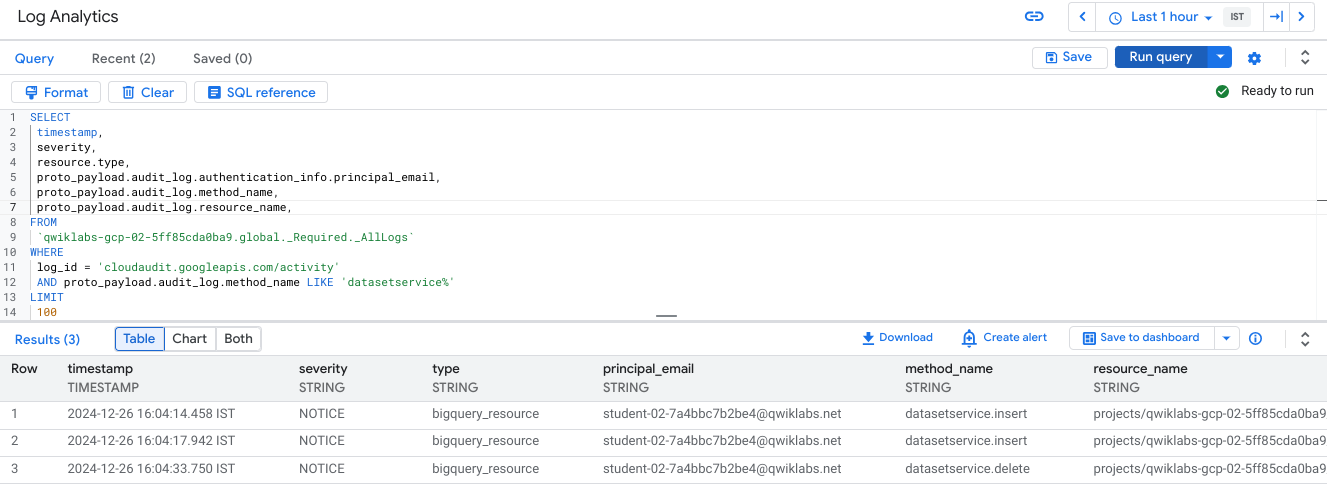
- You should see the output like the following. You can also limit your search with more specifics such as
method_name = 'datasetservice.delete'.
results for datasetservice query
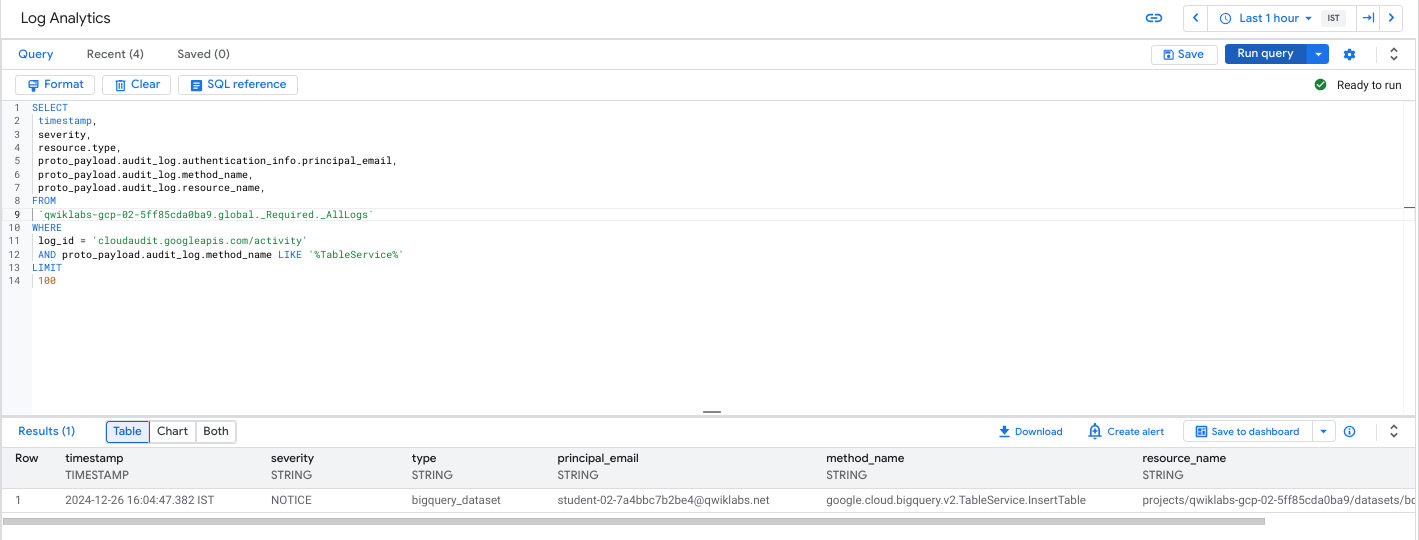
- To find the operations for BigQuery tables, change the query condition for table services. Run this query to find operations on tables that are created or deleted:
SELECT
 timestamp,
 severity,
 resource.type,
 proto_payload.audit_log.authentication_info.principal_email,
 proto_payload.audit_log.method_name,
 proto_payload.audit_log.resource_name,
FROM
 `[Your Project Id].global._Required._AllLogs`
WHERE
 log_id = 'cloudaudit.googleapis.com/activity'
 AND proto_payload.audit_log.method_name LIKE '%TableService%'
LIMIT
 100
You should see the output like the following:
- To view completed BigQuery queries, search the
data_accesslog based on thejobCompletedEvent. For example, run the following SQL query:
SELECT
 timestamp,
 resource.labels.project_id,
 proto_payload.audit_log.authentication_info.principal_email,
 JSON_VALUE(proto_payload.audit_log.service_data.jobCompletedEvent.job.jobConfiguration.query.query) AS query,
 JSON_VALUE(proto_payload.audit_log.service_data.jobCompletedEvent.job.jobConfiguration.query.statementType) AS statementType,
 JSON_VALUE(proto_payload.audit_log.service_data.jobCompletedEvent.job.jobStatus.error.message) AS message,
 JSON_VALUE(proto_payload.audit_log.service_data.jobCompletedEvent.job.jobStatistics.startTime) AS startTime,
 JSON_VALUE(proto_payload.audit_log.service_data.jobCompletedEvent.job.jobStatistics.endTime) AS endTime,
 CAST(TIMESTAMP_DIFF( CAST(JSON_VALUE(proto_payload.audit_log.service_data.jobCompletedEvent.job.jobStatistics.endTime) AS TIMESTAMP), CAST(JSON_VALUE(proto_payload.audit_log.service_data.jobCompletedEvent.job.jobStatistics.startTime) AS TIMESTAMP), MILLISECOND)/1000 AS INT64) AS run_seconds,
 CAST(JSON_VALUE(proto_payload.audit_log.service_data.jobCompletedEvent.job.jobStatistics.totalProcessedBytes) AS INT64) AS totalProcessedBytes,
 CAST(JSON_VALUE(proto_payload.audit_log.service_data.jobCompletedEvent.job.jobStatistics.totalSlotMs) AS INT64) AS totalSlotMs,
 JSON_VALUE(proto_payload.audit_log.service_data.jobCompletedEvent.job.jobStatistics.referencedTables) AS tables_ref,
 CAST(JSON_VALUE(proto_payload.audit_log.service_data.jobCompletedEvent.job.jobStatistics.totalTablesProcessed) AS INT64) AS totalTablesProcessed,
 CAST(JSON_VALUE(proto_payload.audit_log.service_data.jobCompletedEvent.job.jobStatistics.queryOutputRowCount) AS INT64) AS queryOutputRowCount,
 severity
FROM
 `[Your Project Id].global._Default._Default`
WHERE
 log_id = "cloudaudit.googleapis.com/data_access"
 AND proto_payload.audit_log.service_data.jobCompletedEvent IS NOT NULL
ORDER BY
 startTime
After the SQL query completes, you should see the output like the following:
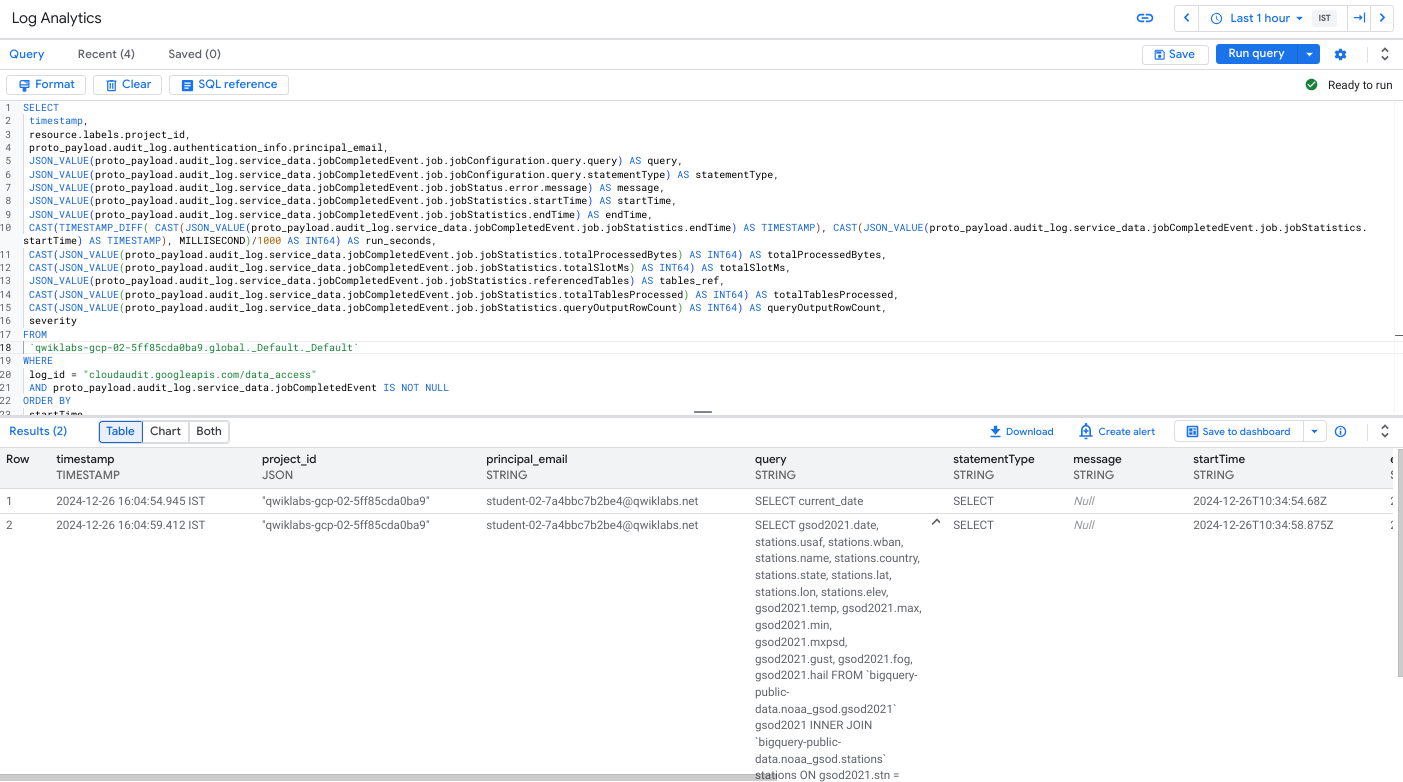
Since the query strings are included in the SQL query, the results might be large. Scroll through the results and look for the completed BigQuery queries.
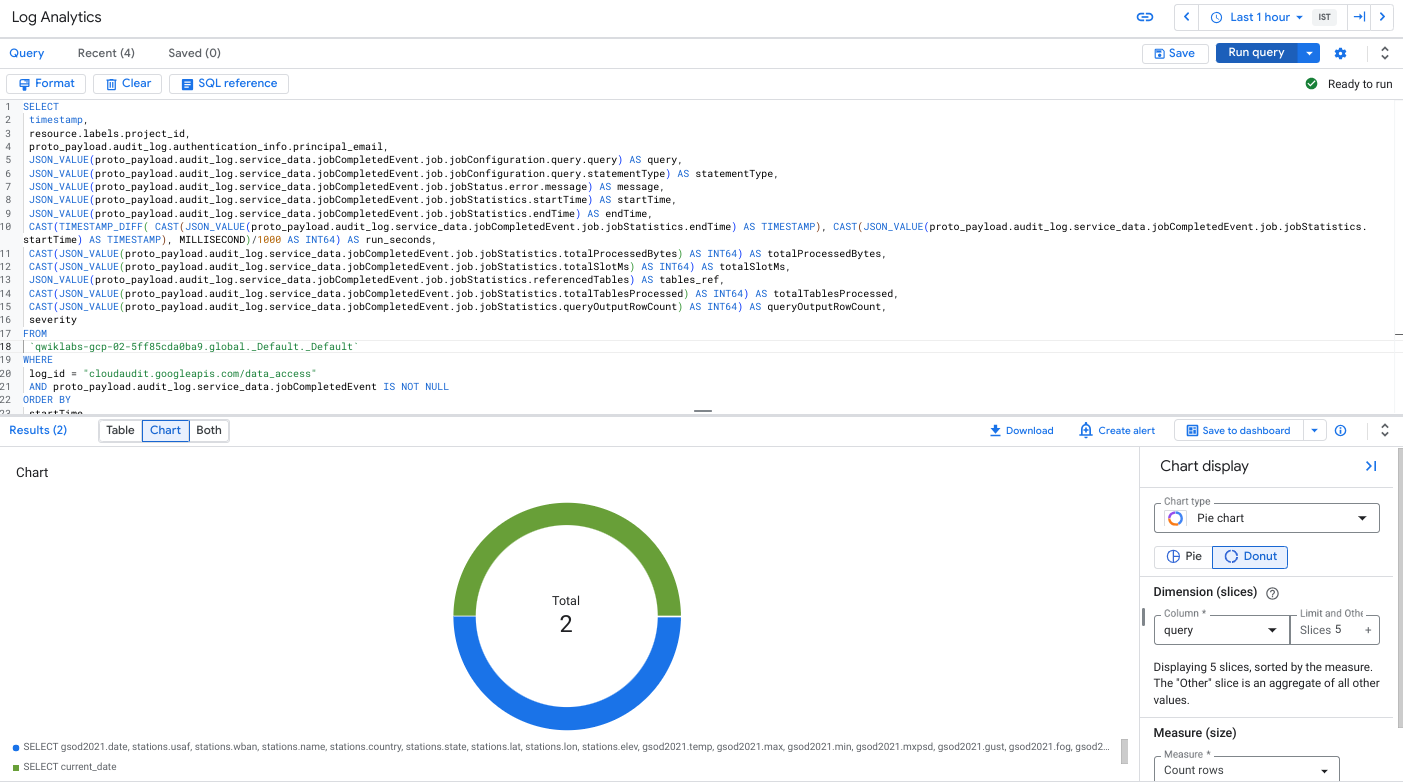
Task 4. Create a chart
Instead of using a table to see the results, Log Analytics supports creating charts for visualization.
Click the Chart button in the result view,
Select Pie chart as the chart type and query as the column.
You should see the chart similar to the following.
Solution of Lab
Open link: https://console.cloud.google.com/logs/storage?cloudshell=true


curl -LO raw.githubusercontent.com/Techcps/Google-Cloud-Skills-Boost/master/Analyze%20BigQuery%20Usage%20with%20Log%20Analytics/techcps1250.sh
sudo chmod +x techcps1250.sh
./techcps1250.sh