Ask Questions to Make Data-Driven Decisions - Module 2 challenge
A passionate full-stack developer from @ePlus.DEV
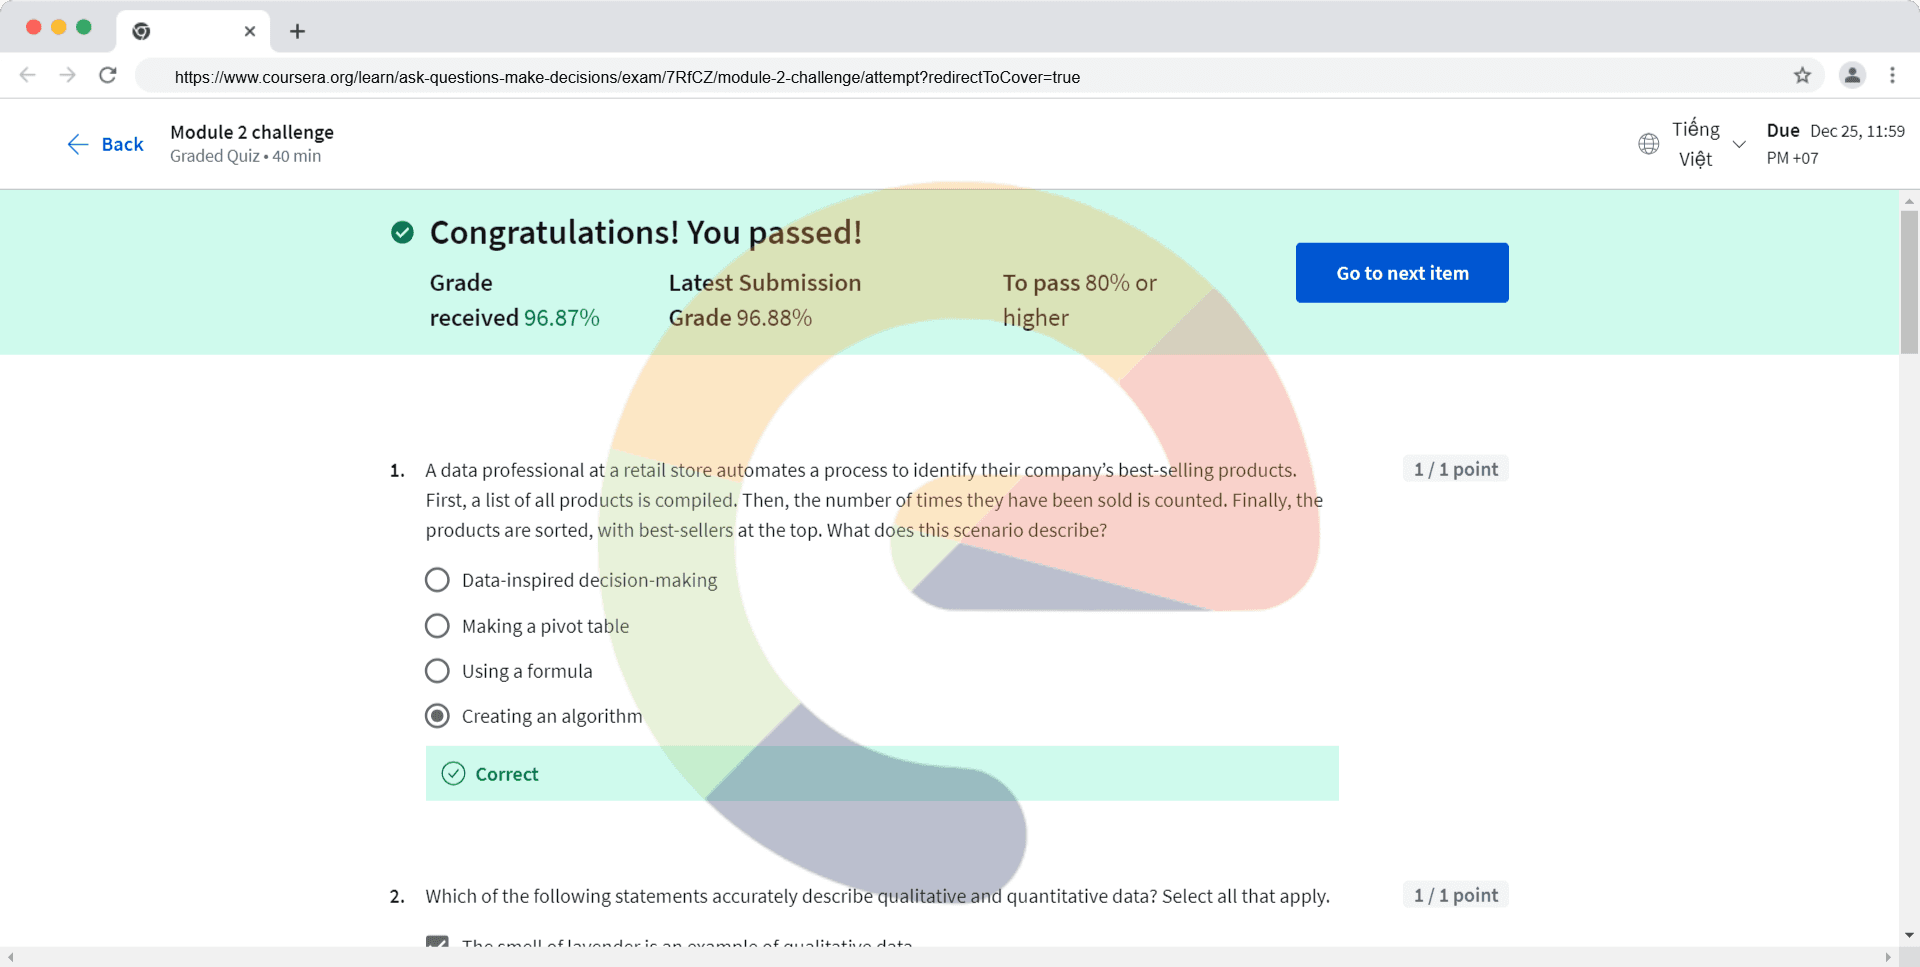
A data professional at a retail store automates a process to identify their company’s best-selling products. First, a list of all products is compiled. Then, the number of times they have been sold is counted. Finally, the products are sorted, with best-sellers at the top. What does this scenario describe?
Data-inspired decision-making
Making a pivot table
Using a formula
Creating an algorithm
Which of the following statements accurately describe qualitative and quantitative data? Select all that apply.
The smell of lavender is an example of qualitative data.
Quantitative data involves things that cannot be measured using numerical data.
The height of a suspension bridge is an example of quantitative data.
Qualitative data involves information that can be quantified.
When working with big data, analysts consider the velocity of processing large, complex datasets. What does this entail?
Evaluating the quality and reliability of the data
Assessing the amount of data to be processed
Understanding how quickly the data can be processed
Identifying the different kinds of data available
A data team uses a spreadsheet tool to create a visualization that summarizes financial data by region, facility, and time period. What tool are they using?
Data validation
Pivot table
Sort
Format
Company decision-makers at a gas utility want to improve business performance. How could they use metrics and a metric goal to help them do so?
Establish a metric goal as a single data point. Then, quantify it with metrics.
Create a metric goal as the business objective. Then, evaluate it using metrics.
Set a metric as the business objective. Then, quantify it using numerous data points.
Develop a metric. Then, evaluate it to determine whether it advances performance.
Which of the following statements correctly describe dashboards and reports? Select all that apply.
Reports and dashboards are both useful for data visualization.
A dashboard could be used to track hourly error rates when programming code.
Reports are effective at capturing high-level, historical data.
Dashboards are designed and distributed periodically as a reference.
Fill in the blank: ROI is calculated by comparing the two metrics of _____, enabling a company to determine the success of the investment.
investment cost and profit
value and expenses
sales and revenue
gross margin and net margin
What are some typical challenges that may be faced by businesses that are beginning to collect and use big data? Select all that apply.
There may be gaps in big data business tools
Less efficient decision-making time frames
Difficulty finding important data
Cannot help large organizations spot trends