Collect Metrics from Exporters using the Managed Service for Prometheus - GSP1026

A passionate full-stack developer from @ePlus.DEV
Overview
In this lab, you will explore using the Managed Service for Prometheus to collect metrics from other infrastructure sources via exporters.
Objectives
In this lab, you will learn how to:
Deploy a GCE instance and configure the node-exporter tool
Build the GMP binary locally and deploy to the GCE instance
Apply a Prometheus configuration to begin collecting metrics
Setup and requirements
Before you click the Start Lab button
Read these instructions. Labs are timed and you cannot pause them. The timer, which starts when you click Start Lab, shows how long Google Cloud resources will be made available to you.
This hands-on lab lets you do the lab activities yourself in a real cloud environment, not in a simulation or demo environment. It does so by giving you new, temporary credentials that you use to sign in and access Google Cloud for the duration of the lab.
To complete this lab, you need:
- Access to a standard internet browser (Chrome browser recommended).
Note: Use an Incognito or private browser window to run this lab. This prevents any conflicts between your personal account and the Student account, which may cause extra charges incurred to your personal account.
- Time to complete the lab---remember, once you start, you cannot pause a lab.
Note: If you already have your own personal Google Cloud account or project, do not use it for this lab to avoid extra charges to your account.
How to start your lab and sign in to the Google Cloud console
Click the Start Lab button. If you need to pay for the lab, a pop-up opens for you to select your payment method. On the left is the Lab Details panel with the following:
The Open Google Cloud console button
Time remaining
The temporary credentials that you must use for this lab
Other information, if needed, to step through this lab
Click Open Google Cloud console (or right-click and select Open Link in Incognito Window if you are running the Chrome browser).
The lab spins up resources, and then opens another tab that shows the Sign in page.
Tip: Arrange the tabs in separate windows, side-by-side.
Note: If you see the Choose an account dialog, click Use Another Account.
If necessary, copy the Username below and paste it into the Sign in dialog.
student-04-0b0b7463d3ae@qwiklabs.netYou can also find the Username in the Lab Details panel.
Click Next.
Copy the Password below and paste it into the Welcome dialog.
V0fmXCBIjnmpYou can also find the Password in the Lab Details panel.
Click Next.
Important: You must use the credentials the lab provides you. Do not use your Google Cloud account credentials.
Note: Using your own Google Cloud account for this lab may incur extra charges.
Click through the subsequent pages:
Accept the terms and conditions.
Do not add recovery options or two-factor authentication (because this is a temporary account).
Do not sign up for free trials.
After a few moments, the Google Cloud console opens in this tab.
Note: To view a menu with a list of Google Cloud products and services, click the Navigation menu at the top-left.

Activate Cloud Shell
Cloud Shell is a virtual machine that is loaded with development tools. It offers a persistent 5GB home directory and runs on the Google Cloud. Cloud Shell provides command-line access to your Google Cloud resources.
Click Activate Cloud Shell
at the top of the Google Cloud console.

When you are connected, you are already authenticated, and the project is set to your Project_ID, qwiklabs-gcp-03-43594179f72c. The output contains a line that declares the Project_ID for this session:
Your Cloud Platform project in this session is set to qwiklabs-gcp-03-43594179f72c
gcloud is the command-line tool for Google Cloud. It comes pre-installed on Cloud Shell and supports tab-completion.
- (Optional) You can list the active account name with this command:
gcloud auth list
- Click Authorize.
Output:
ACTIVE: *
ACCOUNT: student-04-0b0b7463d3ae@qwiklabs.net

To set the active account, run:
    $ gcloud config set account `ACCOUNT`
- (Optional) You can list the project ID with this command:
gcloud config list project
Output:
[core]
project = qwiklabs-gcp-03-43594179f72c
Note: For full documentation of gcloud, in Google Cloud, refer to the gcloud CLI overview guide.
Task 1. Deploy GKE cluster
- Deploy a basic GKE cluster to set up the lab:
gcloud beta container clusters create gmp-cluster --num-nodes=1 --zone us-east4-c --enable-managed-prometheus
gcloud container clusters get-credentials gmp-cluster --zone=us-east4-c
Task 2. Set up a namespace
- Create the
gmp-testKubernetes namespace for resources you create as part of the example application:
kubectl create ns gmp-test
Check if prometheus has been deployed
Check my progress
Task 3. Deploy the example application
The managed service provides a manifest for an example application that emits Prometheus metrics on its metrics port. The application uses three replicas.
- To deploy the example application, run the following command:
kubectl -n gmp-test apply -f https://raw.githubusercontent.com/GoogleCloudPlatform/prometheus-engine/v0.2.3/examples/example-app.yaml
Task 4. Configure a PodMonitoring resource
To ingest the metric data emitted by the example application, you use target scraping. Target scraping and metrics ingestion are configured using Kubernetes custom resources. The managed service uses PodMonitoring custom resources (CRs).
A PodMonitoring CR scrapes targets only in the namespace the CR is deployed in. To scrape targets in multiple namespaces, deploy the same PodMonitoring CR in each namespace. You can verify the PodMonitoring resource is installed in the intended namespace by running kubectl get podmonitoring -A.
For reference documentation about all the Managed Service for Prometheus CRs, see the prometheus-engine/doc/api reference.
The following manifest defines a PodMonitoring resource, prom-example, in the gmp-test namespace. The resource uses a Kubernetes label selector to find all pods in the namespace that have the label app with the value prom-example. The matching pods are scraped on a port named metrics, every 30 seconds, on the /metrics HTTP path.
apiVersion: monitoring.googleapis.com/v1alpha1
kind: PodMonitoring
metadata:
  name: prom-example
spec:
  selector:
    matchLabels:
      app: prom-example
  endpoints:
  - port: metrics
    interval: 30s
- To apply this resource, run the following command:
kubectl -n gmp-test apply -f https://raw.githubusercontent.com/GoogleCloudPlatform/prometheus-engine/v0.2.3/examples/pod-monitoring.yaml
Your managed collector is now scraping the matching pods.
To configure horizontal collection that applies to a range of pods across all namespaces, use the ClusterPodMonitoring resource. The ClusterPodMonitoring resource provides the same interface as the PodMonitoring resource but does not limit discovered pods to a given namespace.
Note: An additional targetLabels field provides a simplified Prometheus-style relabel configuration. You can use relabeling to add pod labels as labels on the ingested time series. You can't overwrite the mandatory target labels; for a list of these labels, see the prometheus_target resource.
If you are running on GKE, then you can do the following:
To query the metrics ingested by the example application, see Query data from the Prometheus service.
To learn about filtering exported metrics and adapting your prom-operator resources, see Additional topics for managed collection.
Task 5. Download the prometheus binary
- Download the prometheus binary from the following bucket:
git clone https://github.com/GoogleCloudPlatform/prometheus && cd prometheus
git checkout v2.28.1-gmp.4
wget https://storage.googleapis.com/kochasoft/gsp1026/prometheus
chmod a+x prometheus
Task 6. Run the prometheus binary
- Save your project id to a variable:
export PROJECT_ID=$(gcloud config get-value project)
- Save your zone to a variable. These values will be used when running your promtheus binary.
export ZONE=us-east4-c
- Run the prometheus binary on cloud shell using command here:
./prometheus \
  --config.file=documentation/examples/prometheus.yml --export.label.project-id=$PROJECT_ID --export.label.location=$ZONE
After the prometheus binary begins you should be able to go to managed prometheus in the Console UI and run a PromQL query “up” to see the prometheus binary is available (will show localhost running one as the instance name).
Task 7. Download and run the node exporter
Open a new tab in cloud shell to run the node exporter commands.
Download and run the exporter on the cloud shell box:
wget https://github.com/prometheus/node_exporter/releases/download/v1.3.1/node_exporter-1.3.1.linux-amd64.tar.gz
tar xvfz node_exporter-1.3.1.linux-amd64.tar.gz
cd node_exporter-1.3.1.linux-amd64
./node_exporter
Note: The port that the node_exporter tool is running on you will use to modify the config of prometheus on the next few steps.
You should see output like this indicating that the Node Exporter is now running and exposing metrics on port 9100:
ts=2023-03-01T10:27:17.262Z caller=node_exporter.go:199 level=info msg="Listening on" address=:9100
ts=2023-03-01T10:27:17.263Z caller=tls_config.go:195 level=info msg="TLS is disabled." http2=false
Create a config.yaml file
- Stop the running prometheus binary in the 1st tab of Cloud Shell and have a new config file which will take the metrics from node exporter:
vi config.yaml
- Create a config.yaml file with the following spec:
global:
  scrape_interval: 15s

scrape_configs:
  - job_name: node
    static_configs:
      - targets: ['localhost:9100']
- Upload the config.yaml file you created to verify:
export PROJECT=$(gcloud config get-value project)
gsutil mb -p $PROJECT gs://$PROJECT
gsutil cp config.yaml gs://$PROJECT
gsutil -m acl set -R -a public-read gs://$PROJECT
Check if config.yaml is configured correctly
Check my progress
- Re-run prometheus pointing to the new configuration file by running the command below:
./prometheus --config.file=config.yaml --export.label.project-id=$PROJECT --export.label.location=$ZONE
- Use the following stat from the exporter to see its count in a PromQL query. In Cloud Shell, click on the web preview icon. Set the port to
9090by selecting Change Preview Port and preview by clicking Change and Preview.
Write any query in the PromQL query Editor prefixed with “node_” this should bring up an input list of metrics you can select to visualize in the graphical editor.
- "node_cpu_seconds_total" provides graphical data.
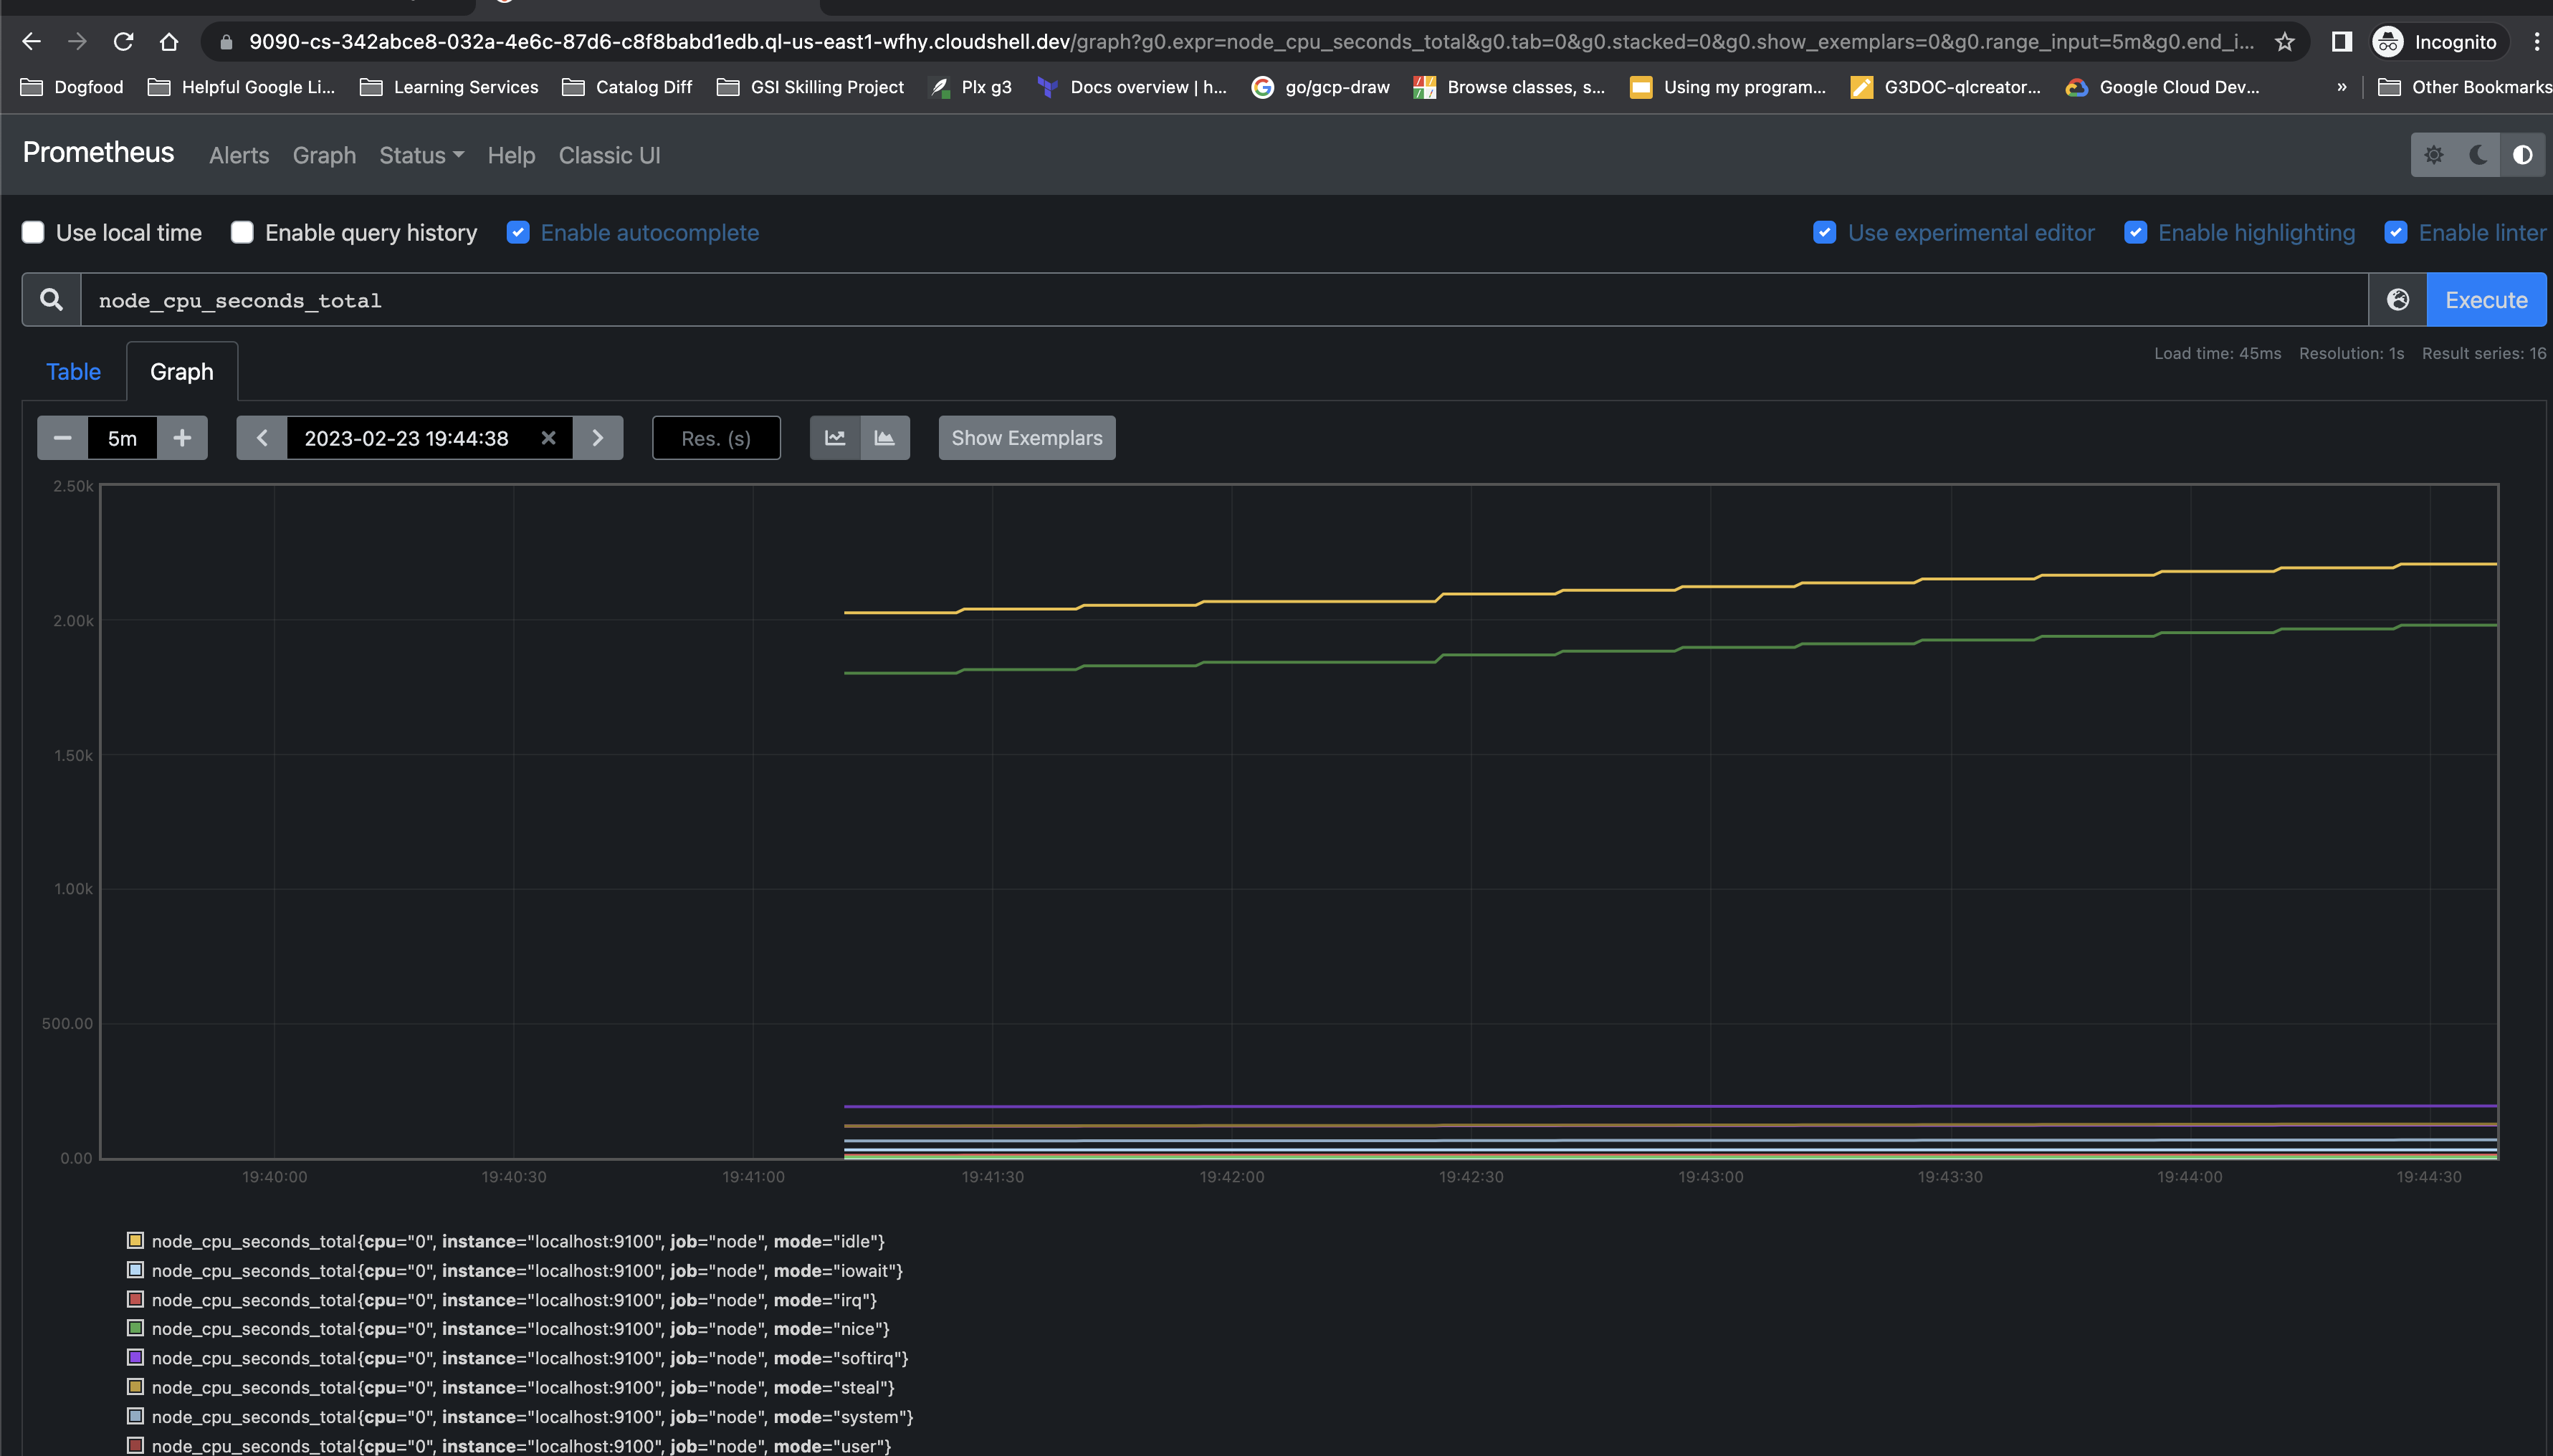
Try selecting other metrics that appear to view the data exported.
Solution of Lab
curl -LO raw.githubusercontent.com/ePlus-DEV/storage/refs/heads/main/labs/GSP1026/lab.sh
source lab.sh
Script Alternative
curl -LO https://github.com/ArcadeCrew/Google-Cloud-Labs/raw/refs/heads/main/Collect%20Metrics%20from%20Exporters%20using%20the%20Managed%20Service%20for%20Prometheus/arcadecrew.sh
sudo chmod +x arcadecrew.sh
./arcadecrew.sh