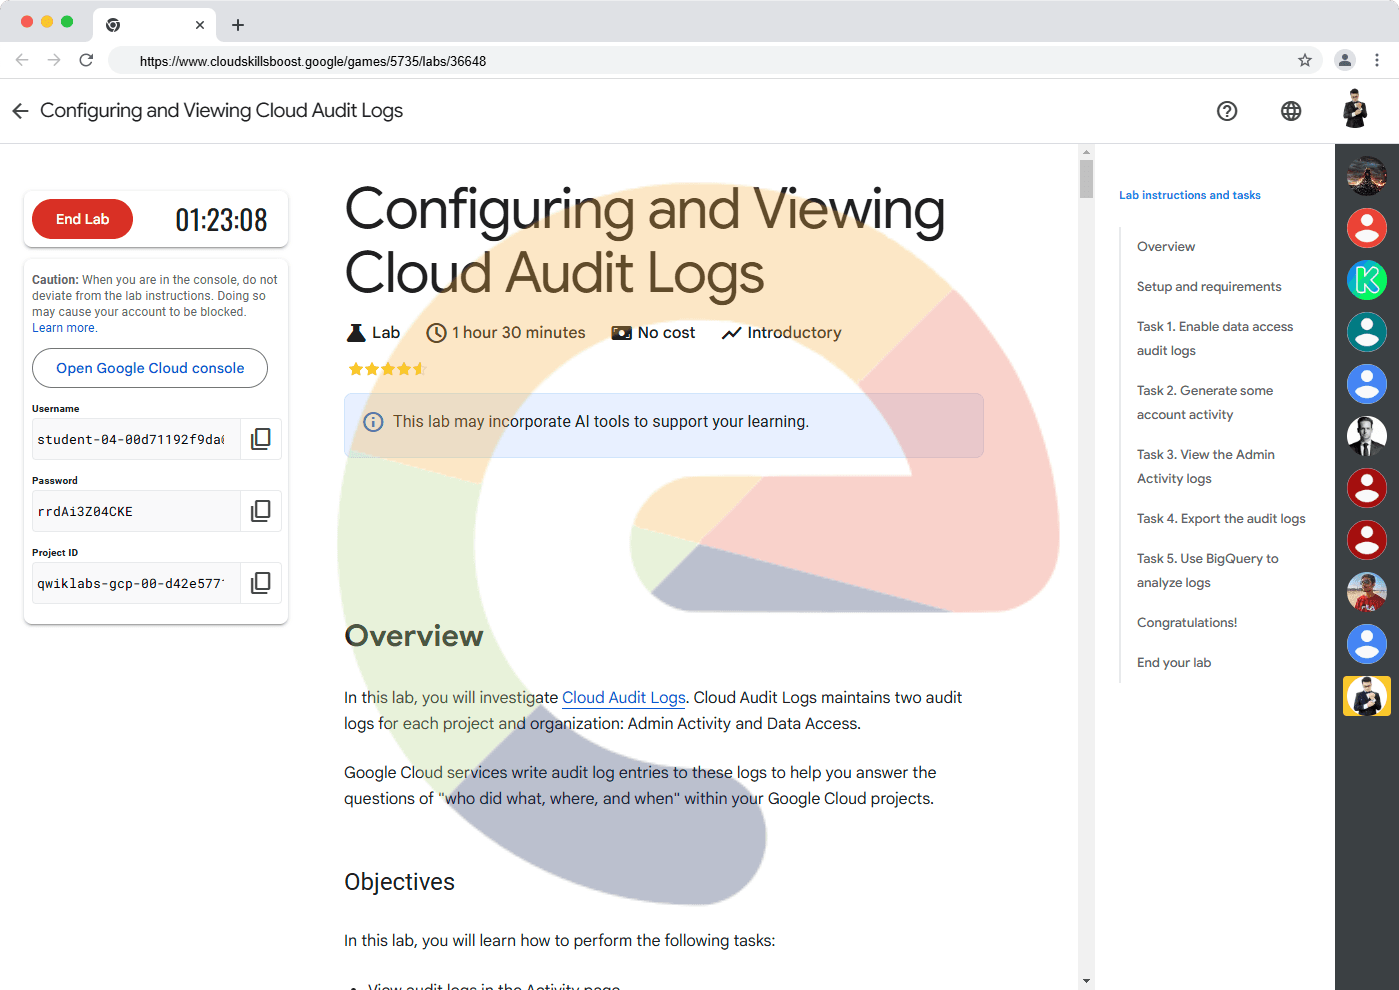
Configuring and Viewing Cloud Audit Logs
A passionate full-stack developer from @ePlus.DEV
Overview
In this lab, you will investigate Cloud Audit Logs. Cloud Audit Logs maintains two audit logs for each project and organization: Admin Activity and Data Access.
Google Cloud services write audit log entries to these logs to help you answer the questions of "who did what, where, and when" within your Google Cloud projects.
Objectives
In this lab, you will learn how to perform the following tasks:
View audit logs in the Activity page.
View and filter audit logs in Cloud Logging.
Retrieve log entries with gcloud.
Export audit logs.
Setup and requirements
For each lab, you get a new Google Cloud project and set of resources for a fixed time at no cost.
Sign in to Qwiklabs using an incognito window.
Note the lab's access time (for example,
1:15:00), and make sure you can finish within that time.
There is no pause feature. You can restart if needed, but you have to start at the beginning.When ready, click Start lab.
Note your lab credentials (Username and Password). You will use them to sign in to the Google Cloud Console.
Click Open Google Console.
Click Use another account and copy/paste credentials for this lab into the prompts.
If you use other credentials, you'll receive errors or incur charges.Accept the terms and skip the recovery resource page.
Activate Google Cloud Shell
Google Cloud Shell is a virtual machine that is loaded with development tools. It offers a persistent 5GB home directory and runs on the Google Cloud.
Google Cloud Shell provides command-line access to your Google Cloud resources.
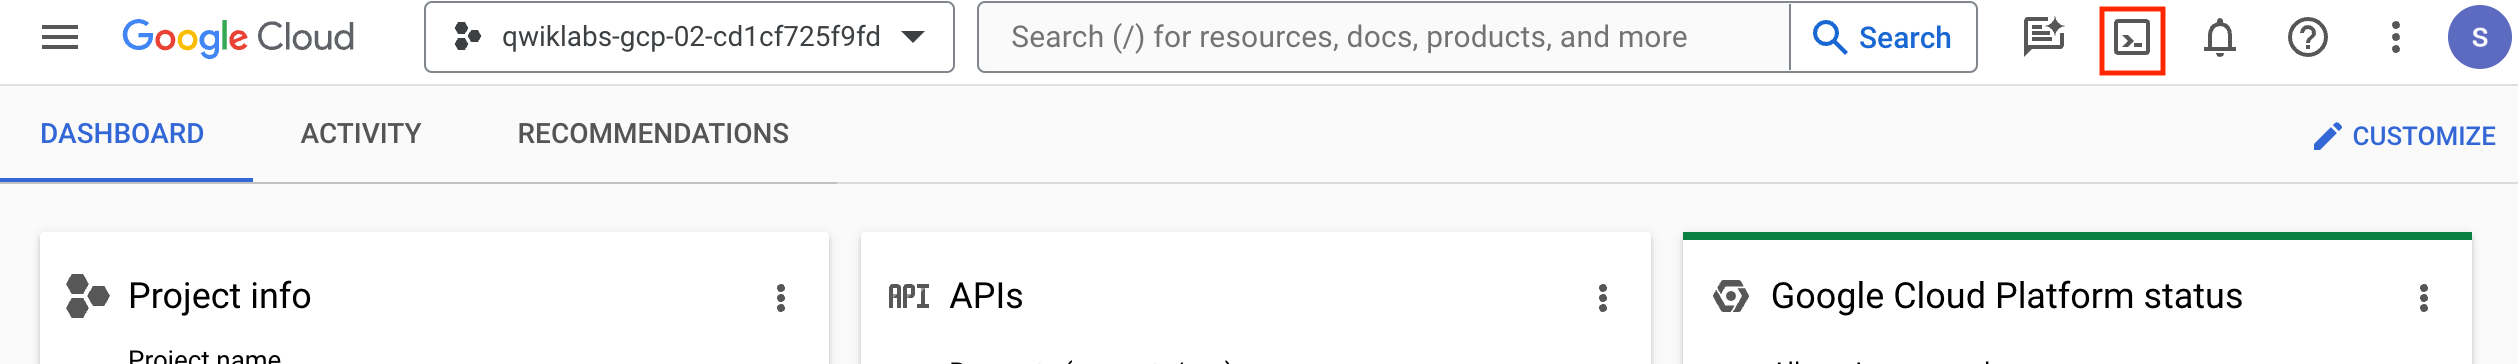
In Cloud console, on the top right toolbar, click the Open Cloud Shell button.
Click Continue.
It takes a few moments to provision and connect to the environment. When you are connected, you are already authenticated, and the project is set to your PROJECT_ID. For example:

gcloud is the command-line tool for Google Cloud. It comes pre-installed on Cloud Shell and supports tab-completion.
- You can list the active account name with this command:
gcloud auth list
Output:
Credentialed accounts:
 - @.com (active)
Example output:
Credentialed accounts:
 - google1623327_student@qwiklabs.net
- You can list the project ID with this command:
gcloud config list project
Output:
[core]
project =
Example output:
[core]
project = qwiklabs-gcp-44776a13dea667a6
Note: Full documentation of gcloud is available in the gcloud CLI overview guide .
Check project permissions
Before you begin your work on Google Cloud, you need to ensure that your project has the correct permissions within Identity and Access Management (IAM).
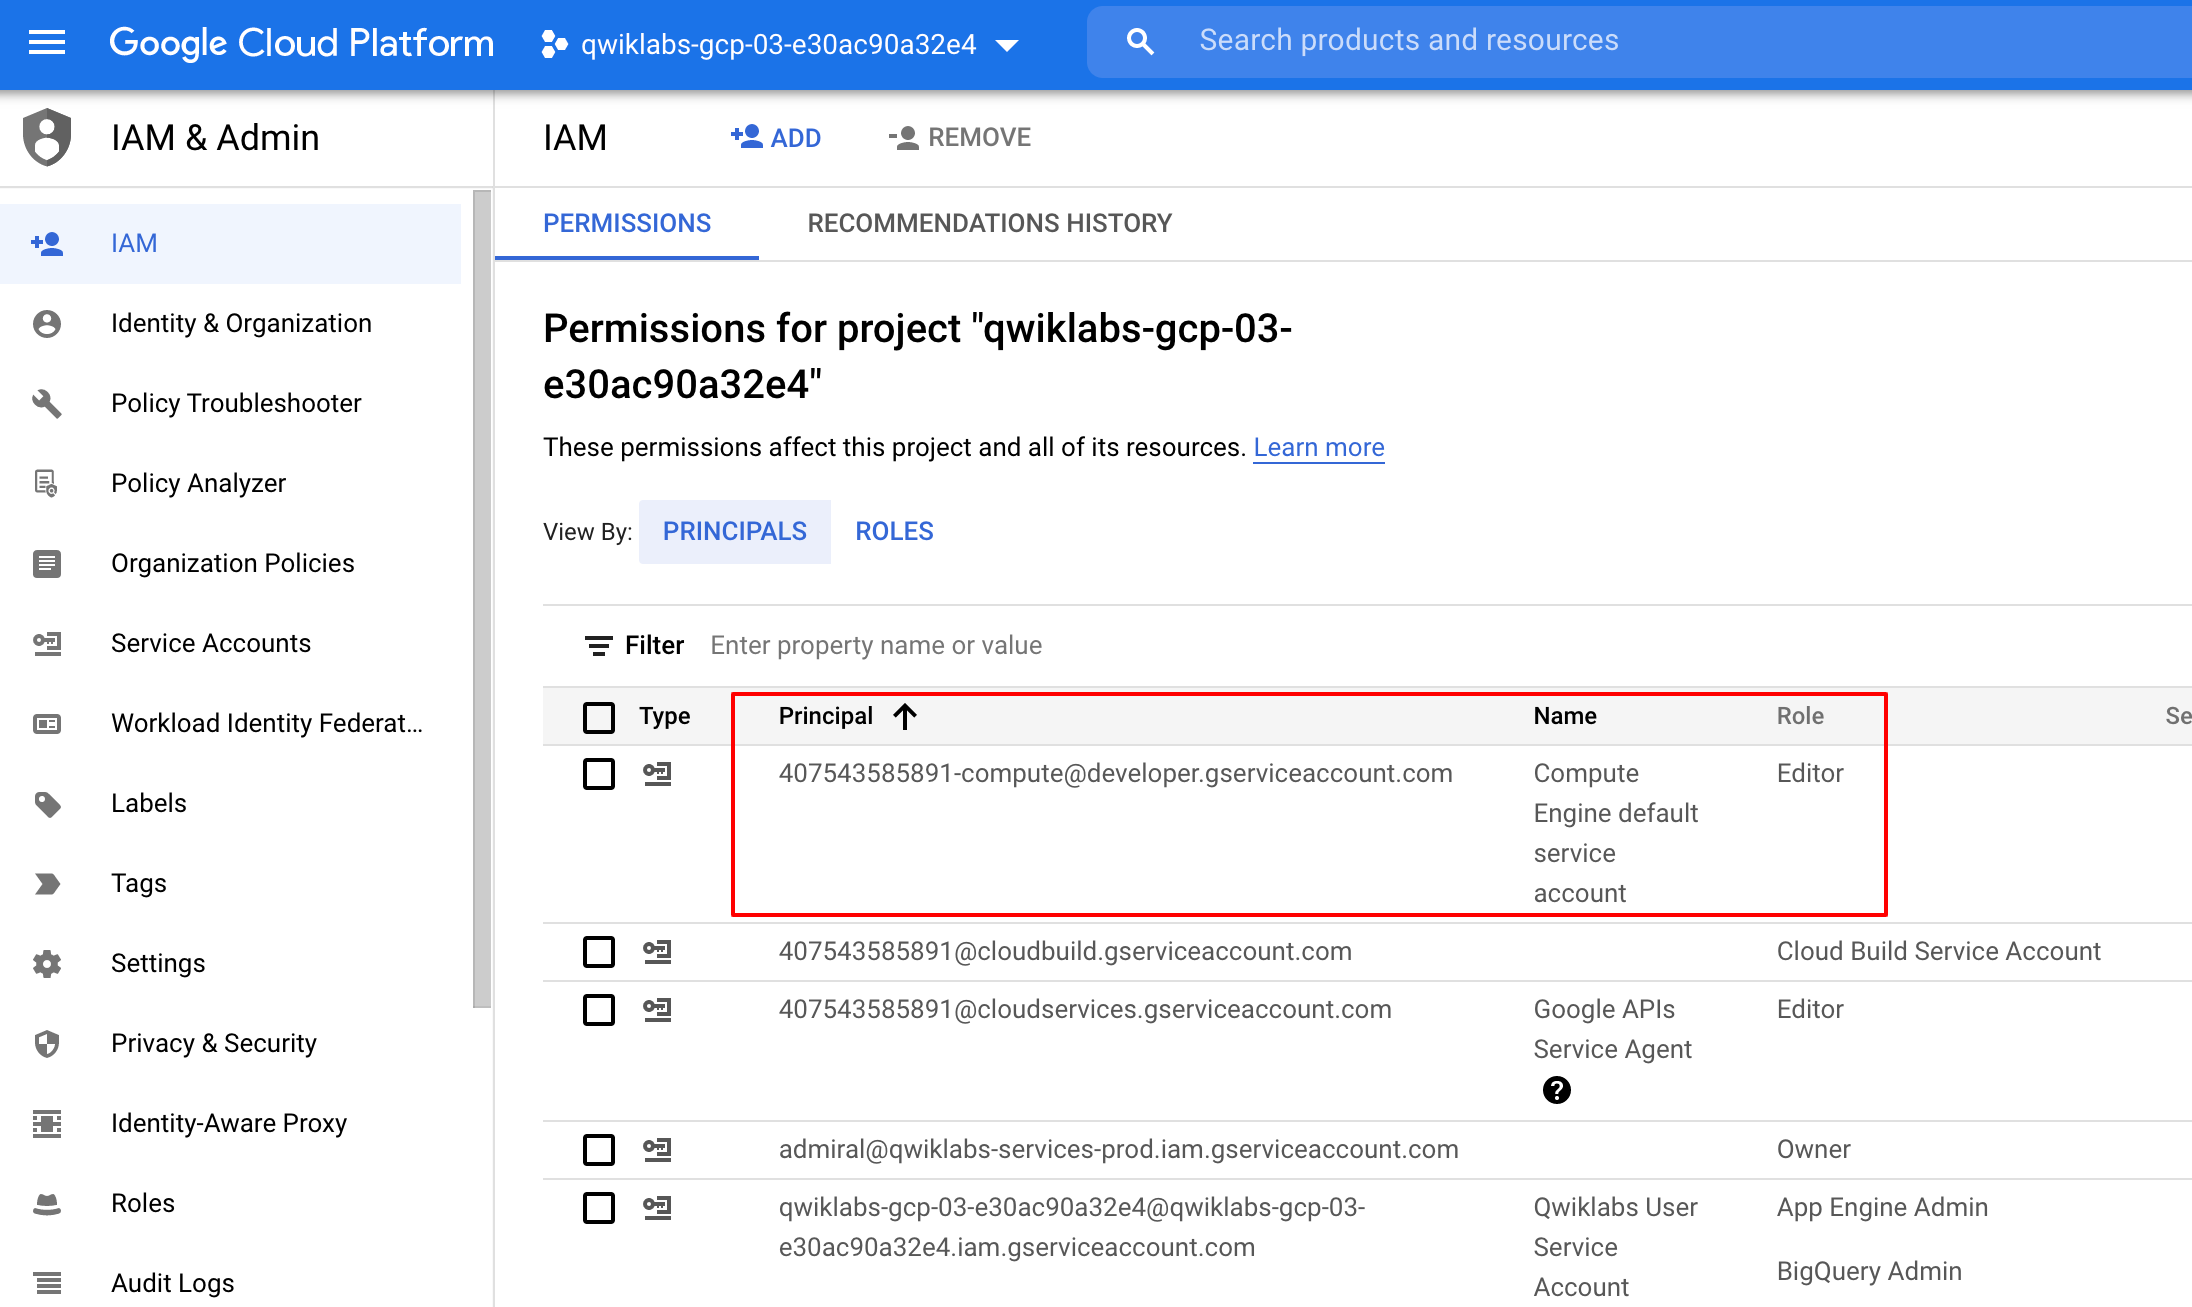
In the Google Cloud console, on the Navigation menu (), select IAM & Admin > IAM.
Confirm that the default compute Service Account
{project-number}-compute@developer.gserviceaccount.comis present and has theeditorrole assigned. The account prefix is the project number, which you can find on Navigation menu > Cloud overview > Dashboard.
Note: If the account is not present in IAM or does not have the editor role, follow the steps below to assign the required role.
In the Google Cloud console, on the Navigation menu, click Cloud overview > Dashboard.
Copy the project number (e.g.
729328892908).On the Navigation menu, select IAM & Admin > IAM.
At the top of the IAM page, click + Grant Access.
For New principals, type:
{project-number}-compute@developer.gserviceaccount.com
Replace
{project-number}with your project number.For Select a role, select Project (or Basic) > Editor.
Click Save.
Task 1. Enable data access audit logs
In this task, you enable data access audit logs.
Data access audit logs (except for BigQuery) are disabled by default, so you must first enable all audit logs. Logging charges for the volume of log data that exceeds the free monthly logs allotment.
All logs received by Logging count towards the logs allotment limit, except for the Cloud Audit Logs that are enabled by default. This includes all Google Cloud Admin Activity audit logs, System Event logs, plus data access audit logs from BigQuery only.
If you have not activated cloud shell yet then, on the Google Cloud Console title bar, click Activate Cloud Shell (
). If prompted, click Continue.
At the command prompt, run this command to retrieve the current IAM policy for your project and save it as
policy.json:

gcloud projects get-iam-policy $DEVSHELL_PROJECT_ID \
--format=json >./policy.json
- Click the Open Editor button to view the Cloud Shell code editor.
If an error indicates that the code editor could not be loaded because third-party cookies are disabled, click Open in New Window and switch to the new tab.
In the Cloud Shell code editor, click the policy.json file to expose its contents.
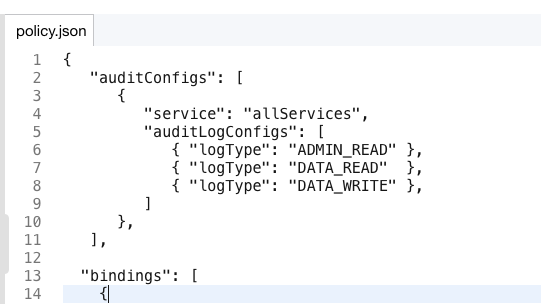
Add the following text to the
policy.jsonfile to enable data Access audit logs for all services. This text should be added just after the first{and before"bindings": [. (Be careful not to change anything else in the file).
   "auditConfigs": [
      {
         "service": "allServices",
         "auditLogConfigs": [
            { "logType": "ADMIN_READ" },
            { "logType": "DATA_READ"  },
            { "logType": "DATA_WRITE" }
         ]
      }
   ],
The file will look similar to below.
Click the Open Terminal button to return to the Cloud Shell command line.
At the command line, run the following command to set the IAM policy:
gcloud projects set-iam-policy $DEVSHELL_PROJECT_ID \
./policy.json
The command will return and display the new IAM policy.
Task 2. Generate some account activity
In this task, you create resources that generate log activty that you can view in Cloud Audit logs.
- In Cloud Shell, run the following commands to create a few resources. This will generate some activity that you will view in the audit logs:
gsutil mb gs://$DEVSHELL_PROJECT_ID
echo "this is a sample file" > sample.txt
gsutil cp sample.txt gs://$DEVSHELL_PROJECT_ID
gcloud compute networks create mynetwork --subnet-mode=auto
gcloud compute instances create default-us-vm \
--machine-type=e2-micro \
--zone=europe-west4-c --network=mynetwork
gsutil rm -r gs://$DEVSHELL_PROJECT_ID
Task 3. View the Admin Activity logs
In this task, you view the Admin Activity logs.
Admin Activity logs contain log entries for API calls or other administrative actions that modify the configuration or metadata of resources. For example, the logs record when VM instances and App Engine applications are created and when permissions are changed.
To view the logs, you must have the Cloud Identity and Access Management roles Logging/Logs Viewer or Project/Viewer.
Admin Activity logs are always enabled so there is no need to enable them. There is no charge for your Admin Activity audit logs.
Note: You can view audit log entries in the Logs Viewer, Cloud Logging, and in the Cloud SDK. You can also export audit log entries to Pub/Sub, BigQuery, or Cloud Storage.
Use the Cloud Logging page
From the Cloud Console, select Navigation menu > Logging > Logs Explorer.
Paste the following in the Query builder field and replace
[PROJECT_ID]with your project ID. You can copy the PROJECT_ID from the Qwiklabs Connection Details.
logName = ("projects/[PROJECT_ID]/logs/cloudaudit.googleapis.com%2Factivity")
Click the Run Query button.
Locate the log entry indicating that a Cloud Storage bucket was deleted. This entry will refer to
storage.googleapis.com, which calls thestorage.buckets.deletemethod to delete a bucket. The bucket name is the same name as your project id.Within that entry, click on the storage.googleapis.com text and select Show matching entries.
Notice a line was added to the query preview textbox (located where the query builder had been) to show only storage events.
logName = ("projects/qwiklabs-gcp-xxxxxxxxx/logs/cloudaudit.googleapis.com%2Factivity")
protoPayload.serviceName="storage.googleapis.com"
You should now see only the cloud storage entries.
Within that entry, click on the storage.buckets.delete text and select Show matching entries.
Notice another line was added to the Query preview textbox and now you can only see storage delete entries.
This technique can be used to easily locate desired events.
In the Query results, expand the Cloud Storage delete entry and then expand the protoPayload field.
Expand the authenticationInfo field and notice you can see the email address of the user that performed this action.
Feel free to explore other fields in the entry.
Use the Cloud SDK
Log entries can also be read using the Cloud SDK command:
Example output:
gcloud logging read [FILTER]
- In the Cloud Shell pane, use this command to retrieve only the audit activity for storage bucket deletion:
Note: If Cloud Shell is disconnected, then click reconnect.
gcloud logging read \
"logName=projects/$DEVSHELL_PROJECT_ID/logs/cloudaudit.googleapis.com%2Factivity \
AND protoPayload.serviceName=storage.googleapis.com \
AND protoPayload.methodName=storage.buckets.delete"
Task 4. Export the audit logs
In this task, you export audit logs. Individual audit log entries are kept for a specified length of time and are then deleted. The Cloud Logging Quota Policy explains how long log entries are retained. You cannot otherwise delete or modify audit logs or their entries.
| Audit log type | Retention period |
Admin Activity | 400 days |
Data Access | 30 days |
For longer retention, you can export audit log entries like any other Cloud Logging log entries and keep them for as long as you wish.
Export audit logs
When exporting logs, the current filter will be applied to what is exported.
- In Logs Explorer, enter a query string in the Query builder to display all the audit logs. (This can be done by deleting all lines in the filter except the first one.) Your filter will look like what is shown below. (Note that your project ID will be different.)
logName = ("projects/[PROJECT_ID]/logs/cloudaudit.googleapis.com%2Factivity")
Click the Run Query button.
Click on Actions > Create Sink button.
For the Sink Name name, enter
AuditLogsExportand click Next.For the Sink service, enter
BigQuery dataset.Click Select BigQuery dataset and then select Create new BigQuery dataset.
For the Dataset ID, enter
auditlogs_datasetand click Create Dataset.Uncheck the Use Partitioned Tables checkbox, if it is already selected, and click Next.
In the Build inclusion filter list box, make sure that this filter text is entered
logName = ("projects/[PROJECT_ID]/logs/cloudaudit.googleapis.com%2Factivity").Click the Create Sink button. The Logs Router Sinks page appears. Now, click on Logs Router.
On this page, you should be able to see the AuditLogsExport sink.
To the right of the AuditLogsExport sink, click the button with three dots (
) and select View sink details.

This will show information about the sink that you created.
- Click Cancel when done.
Note: You could also export log entries to Pub/Sub or Cloud Storage. Exporting to Pub/Sub can be useful if you want to flow through an ETL process prior to storing in a database (Cloud Operations > PubSub > Dataflow > BigQuery/Bigtable). Exporting to Cloud Storage will batch up entries and write them into Cloud Storage objects approximately once an hour.
Note: All future logs will now be exported to BigQuery and the BigQuery tools can be used to perform analysis on the audit log data. The export does not export existing log entries.
- In Cloud Shell, run the following commands to generate some more activity that you will view in the audit logs exported to BigQuery:
gsutil mb gs://$DEVSHELL_PROJECT_ID
gsutil mb gs://$DEVSHELL_PROJECT_ID-test
echo "this is another sample file" > sample2.txt
gsutil cp sample.txt gs://$DEVSHELL_PROJECT_ID-test
gcloud compute instances delete --zone=europe-west4-c \
--delete-disks=all default-us-vm
When prompted, enter y.
gsutil rm -r gs://$DEVSHELL_PROJECT_ID
gsutil rm -r gs://$DEVSHELL_PROJECT_ID-test
Task 5. Use BigQuery to analyze logs
In this task, you export logs to a BigQuery dataset. You then analyze the logs using Query editor.
Note: When you export logs to a BigQuery dataset, Cloud Logging creates dated tables to hold the exported log entries. Log entries are placed in tables whose names are based on the entries' log names.
Go to Navigation menu > BigQuery. If prompted, log in with the Qwiklabs-provided credentials.
The Welcome to BigQuery in the Cloud Console message box opens. This message box provides a link to the quickstart guide and lists UI updates.
Click Done.
In the left pane, under the Explorer section, click your project. This starts with
(qwiklabs-gcp-xxx). You should see an auditlogs_dataset dataset under it.Verify that the BigQuery dataset has appropriate permissions to allow the export writer to store log entries. Click on the auditlogs_dataset dataset.
From the Sharing dropdown, select Permissions.
On the Dataset Permission page, you will see the service account listed as BigQuery Data Editor member. If it's not already listed, you can add a service account under Add Principal and grant it the data editor role.
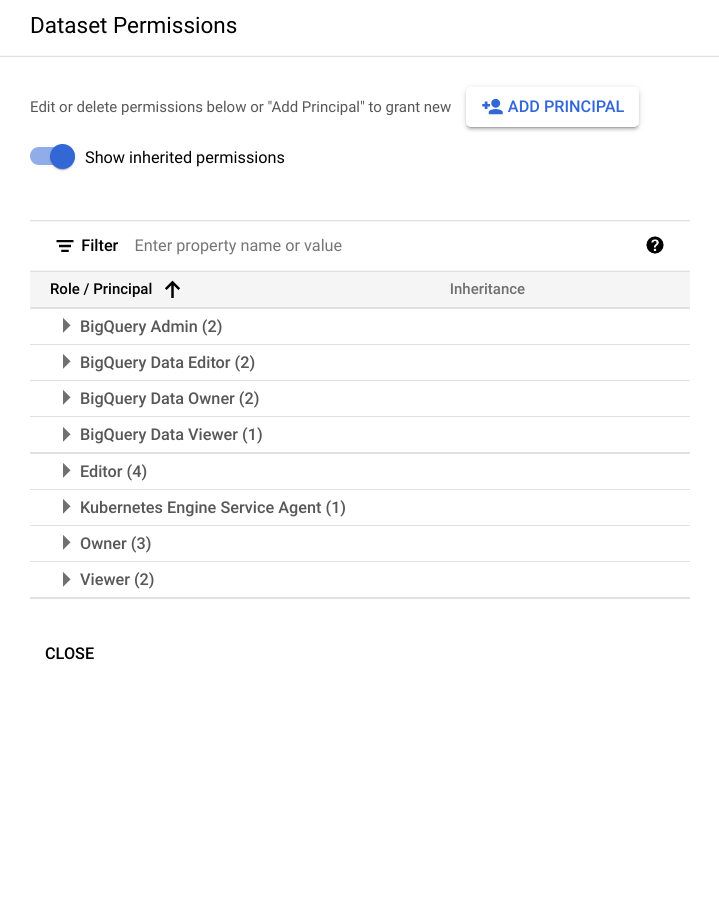
Click the Close button to close the Share Dataset screen.
Expand the dataset to see the table with your exported logs. (Click on the expand icon to expand the dataset.)
Click on the table name and take a moment to review the schemas and details of the tables that are being used.
Click the Query > In new tab button.
In Cloud Shell, run the following commands again to generate some more activity that you will view in the audit logs exported to BigQuery:
gcloud compute instances create default-us-vm \
--zone=europe-west4-c --network=mynetwork
gcloud compute instances delete --zone=europe-west4-c \
--delete-disks=all default-us-vm
When prompted, enter y.
gsutil mb gs://$DEVSHELL_PROJECT_ID
gsutil mb gs://$DEVSHELL_PROJECT_ID-test
gsutil rm -r gs://$DEVSHELL_PROJECT_ID
gsutil rm -r gs://$DEVSHELL_PROJECT_ID-test
- Delete the text provided in the Query editor window and paste in the query below. This query will return the users that deleted virtual machines in the last 7 days.
#standardSQL
SELECT
  timestamp,
  resource.labels.instance_id,
  protopayload_auditlog.authenticationInfo.principalEmail,
  protopayload_auditlog.resourceName,
  protopayload_auditlog.methodName
FROM
`auditlogs_dataset.cloudaudit_googleapis_com_activity_*`
WHERE
  PARSE_DATE('%Y%m%d', _TABLE_SUFFIX) BETWEEN
  DATE_SUB(CURRENT_DATE(), INTERVAL 7 DAY) AND
  CURRENT_DATE()
  AND resource.type = "gce_instance"
  AND operation.first IS TRUE
  AND protopayload_auditlog.methodName = "v1.compute.instances.delete"
ORDER BY
  timestamp,
  resource.labels.instance_id
LIMIT
  1000
Click the Run button. After a couple of seconds you will see each time someone deleted a virtual machine within the past 7 days. You should see two entries, which is the activity you generated in this lab. Remember, BigQuery is only showing activity since the export was created.
Delete the text in the Query_editor window and paste in the query below. This query will return the users that deleted storage buckets in the last 7 days.
#standardSQL
SELECT
  timestamp,
  resource.labels.bucket_name,
  protopayload_auditlog.authenticationInfo.principalEmail,
  protopayload_auditlog.resourceName,
  protopayload_auditlog.methodName
FROM
`auditlogs_dataset.cloudaudit_googleapis_com_activity_*`
WHERE
  PARSE_DATE('%Y%m%d', _TABLE_SUFFIX) BETWEEN
  DATE_SUB(CURRENT_DATE(), INTERVAL 7 DAY) AND
  CURRENT_DATE()
  AND resource.type = "gcs_bucket"
  AND protopayload_auditlog.methodName = "storage.buckets.delete"
ORDER BY
  timestamp,
  resource.labels.instance_id
LIMIT
  1000
- Click the Run button. After a couple seconds you will see entries showing each time someone deleted a storage bucket within the past 7 days.
Note: As you can see, the ability to analyze audit logs in BigQuery is very powerful. In this activity, you viewed just two examples of querying audit logs.
Click Check my progress to verify the objective.
Export audit logs and use BigQuery to analyze logs
Check my progress
Congratulations!
In this lab, you have done the following:
Viewed audit logs on the activity page.
Viewed and filtered audit logs in Cloud Operations.
Retrieved log entries with
gcloud.Exported audit logs.
Solution of Lab
curl -LO raw.githubusercontent.com/QUICK-GCP-LAB/2-Minutes-Labs-Solutions/refs/heads/main/Configuring%20and%20Viewing%20Cloud%20Audit%20Logs/shell.sh
sudo chmod +x shell.sh
./shell.sh
Task 3: Manual