Explore SAP Data Foundation using Looker Dashboards - GSP1046
A passionate full-stack developer from @ePlus.DEV
Overview
In this lab, you will visualize the Google Cloud Cortex Data Foundation for SAP by viewing reports pre-installed into a Looker instance available with this lab.
If you are unfamiliar with the Google Cloud Cortex Data Foundation for SAP you can find out more information about it at the link provided.
This scenario intends to convey how a business analyst would consume reports to have a better idea of how to run the business and make informed decisions with SAP ERP data, all within Looker’s snappy, intuitive interface.
The Google Cloud Cortex Data Foundation for SAP provides Looker Blocks to monitor sales performance and order fulfillment, hone in on customers, orders and products to dig into anomalies or answer new questions. You can find the git repository to install the SAP Cortex Looker Block in your own Looker environment at the link provided.
A connection to the BigQuery instance has been pre-created to support this lab environment.
Task 1 - Enable Developer Mode
In this section, you will review the properties of the Looker Block which require configuration in order to pull data from BigQuery. If you are unfamiliar with Looker Blocks you can read more about them at the documentation site here.
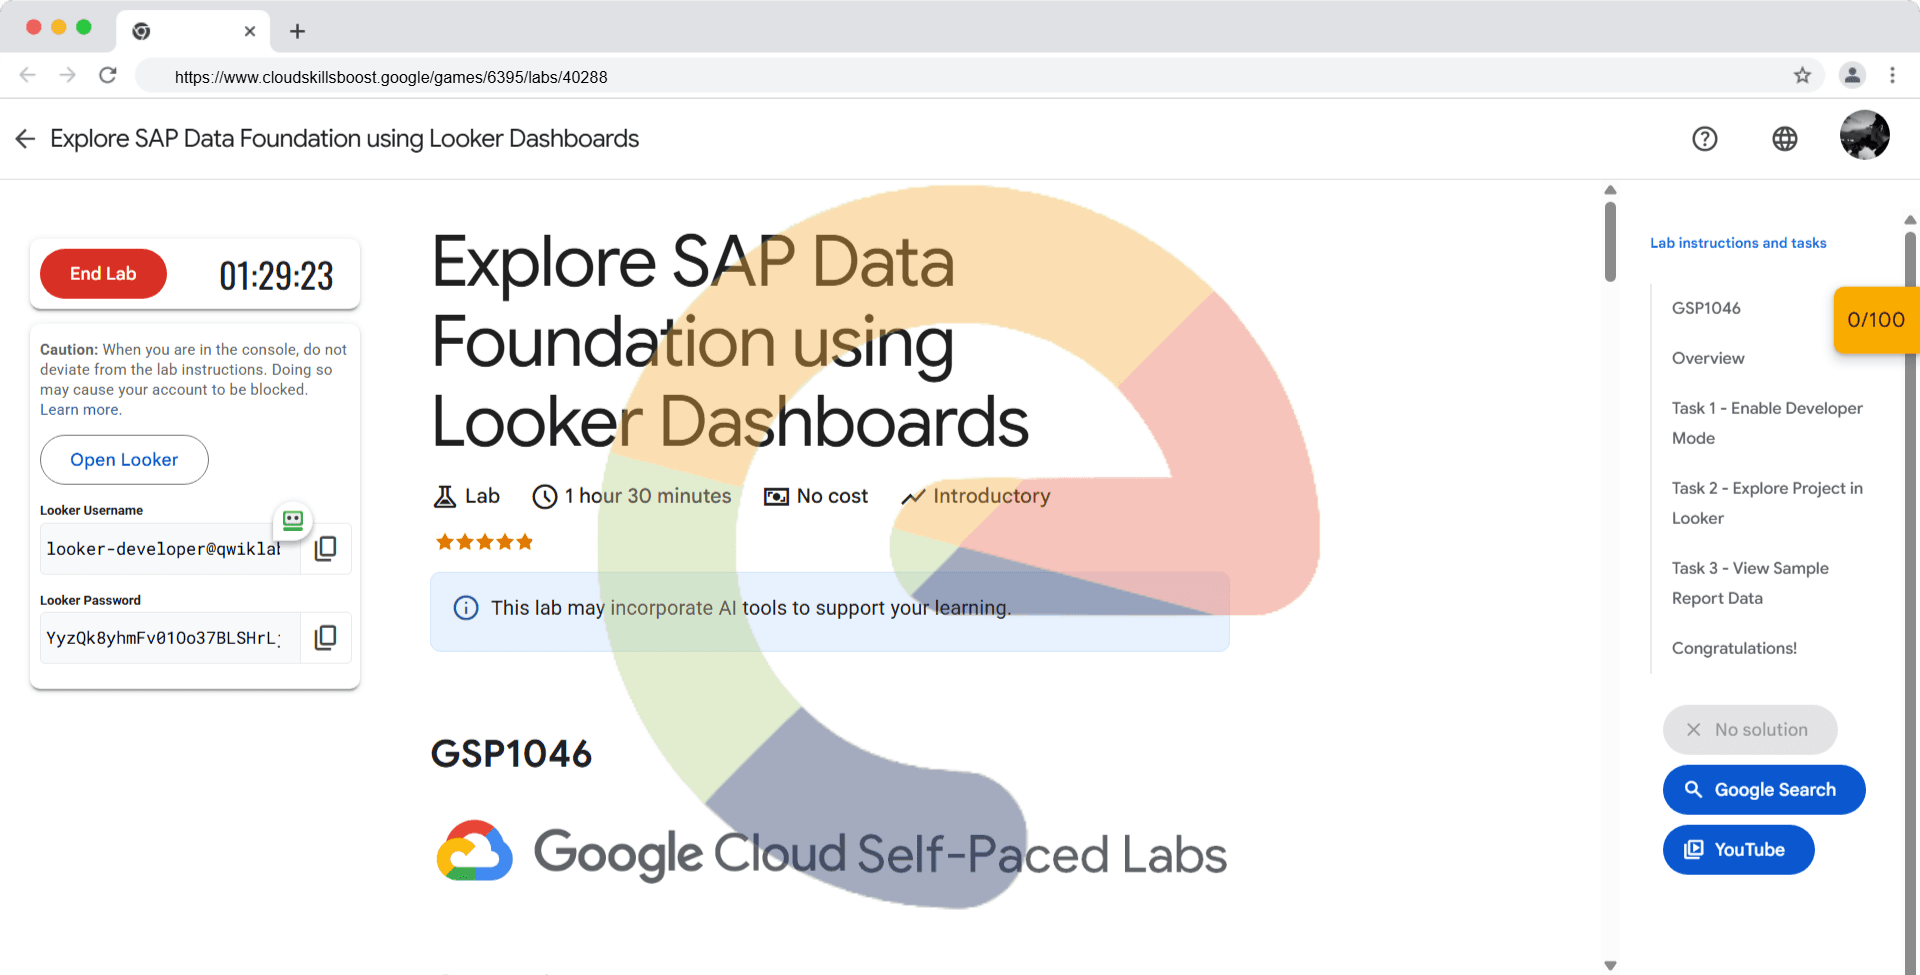
Select the Open Looker button on the student console of the lab and enter the credentials provided to login to the Looker instance available.
Once logged in, enable Development Mode by selecting the toggle button in the bottom left corner of the landing page.
Task 2 - Explore Project in Looker
In the left navigation menu select Develop > cortex_data_foundation.
In the resulting page you will see an editor view of the Looker Block pre-installed into the Looker instance. This will look very similar to the SAP Cortex Looker Block available on GitHub with minor configuration changes.
Notice that a README.md provides instructions on what configurations can be made on this block and how to make them. Open the file manifest.lkml.
Observe the constants CONNECTION_NAME and DATASET defined in the file. These configurations instruct the Looker instance what connection to utilize to pull data warehousing data from (in this case a BigQuery instance) and what dataset that the block should use in the data warehouse instance connection once established.
Task 3 - View Sample Report Data
Navigate back to the Home page of the Looker instance:
- From the Navigation Menu > Folders
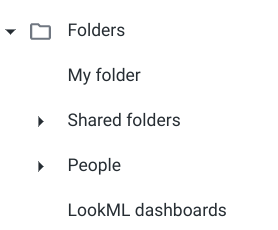
- Select LookML Dashboards from the Folders landing page.
If the LookML Dashboards folder is not present, refresh the page
In the resulting page, select the Sales Analytics report.
Update the Document Date to is in the year 2022 by clicking in the filter box to select the option and fill in the year, and then click Update.
Note that this report may take a few minutes to populate. DO NOT refresh the page multiple times while the report is loading!
The resulting report contains Sales Analytics data which an analyst can use to compare year over year product sales and order fulfillment.
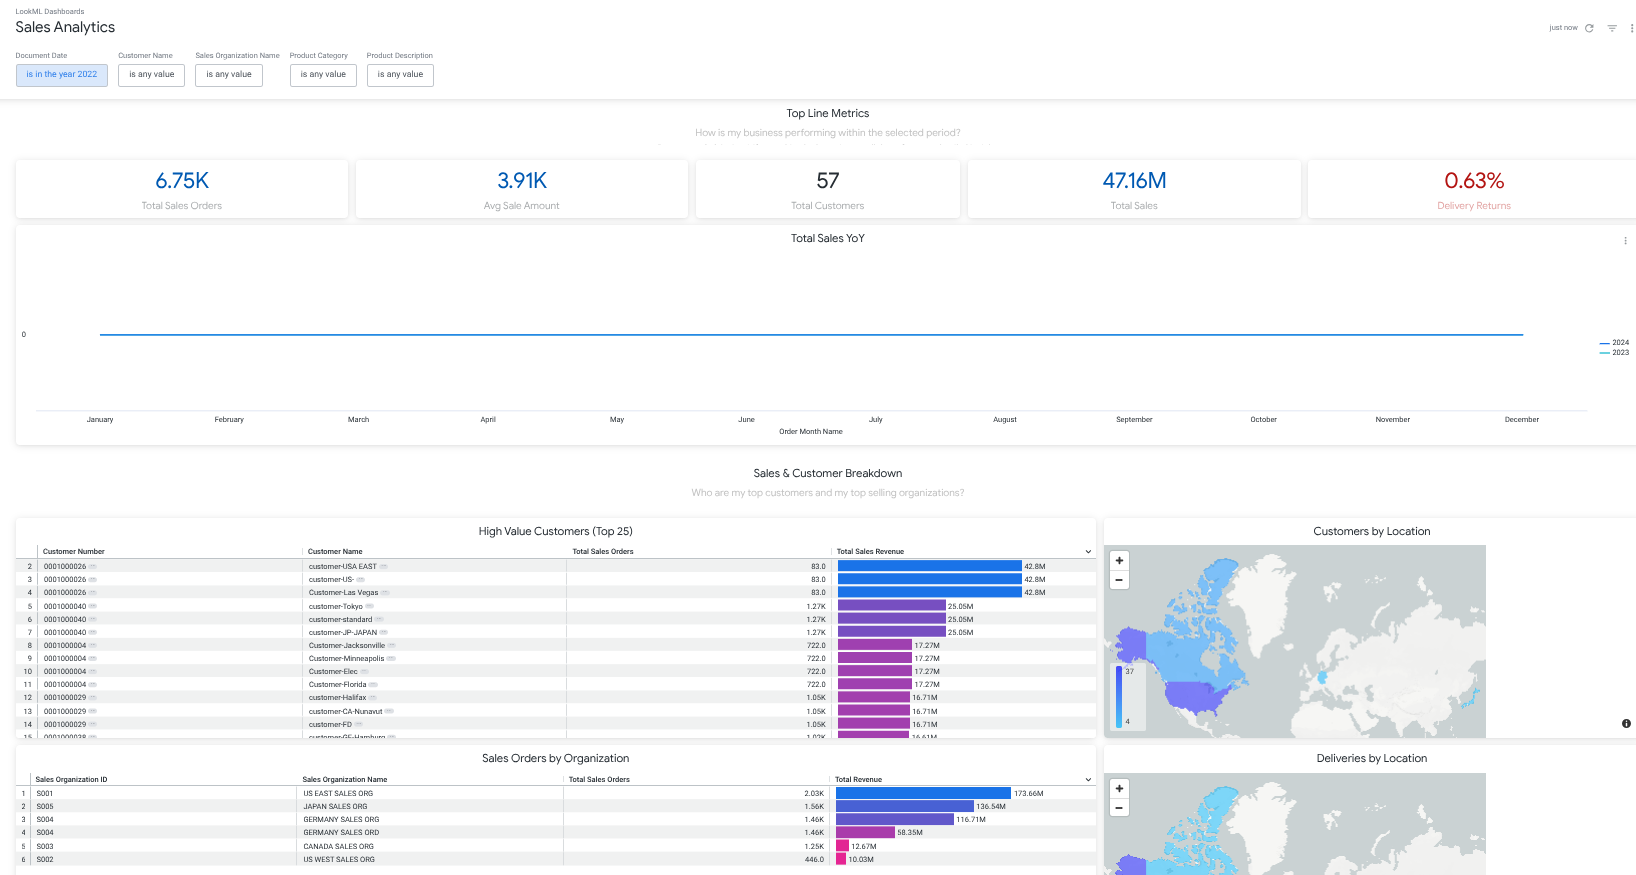
- In the Customers By Location chart, select the United States of America map to drill into the chart data. This will surface a Query result in a popup window.
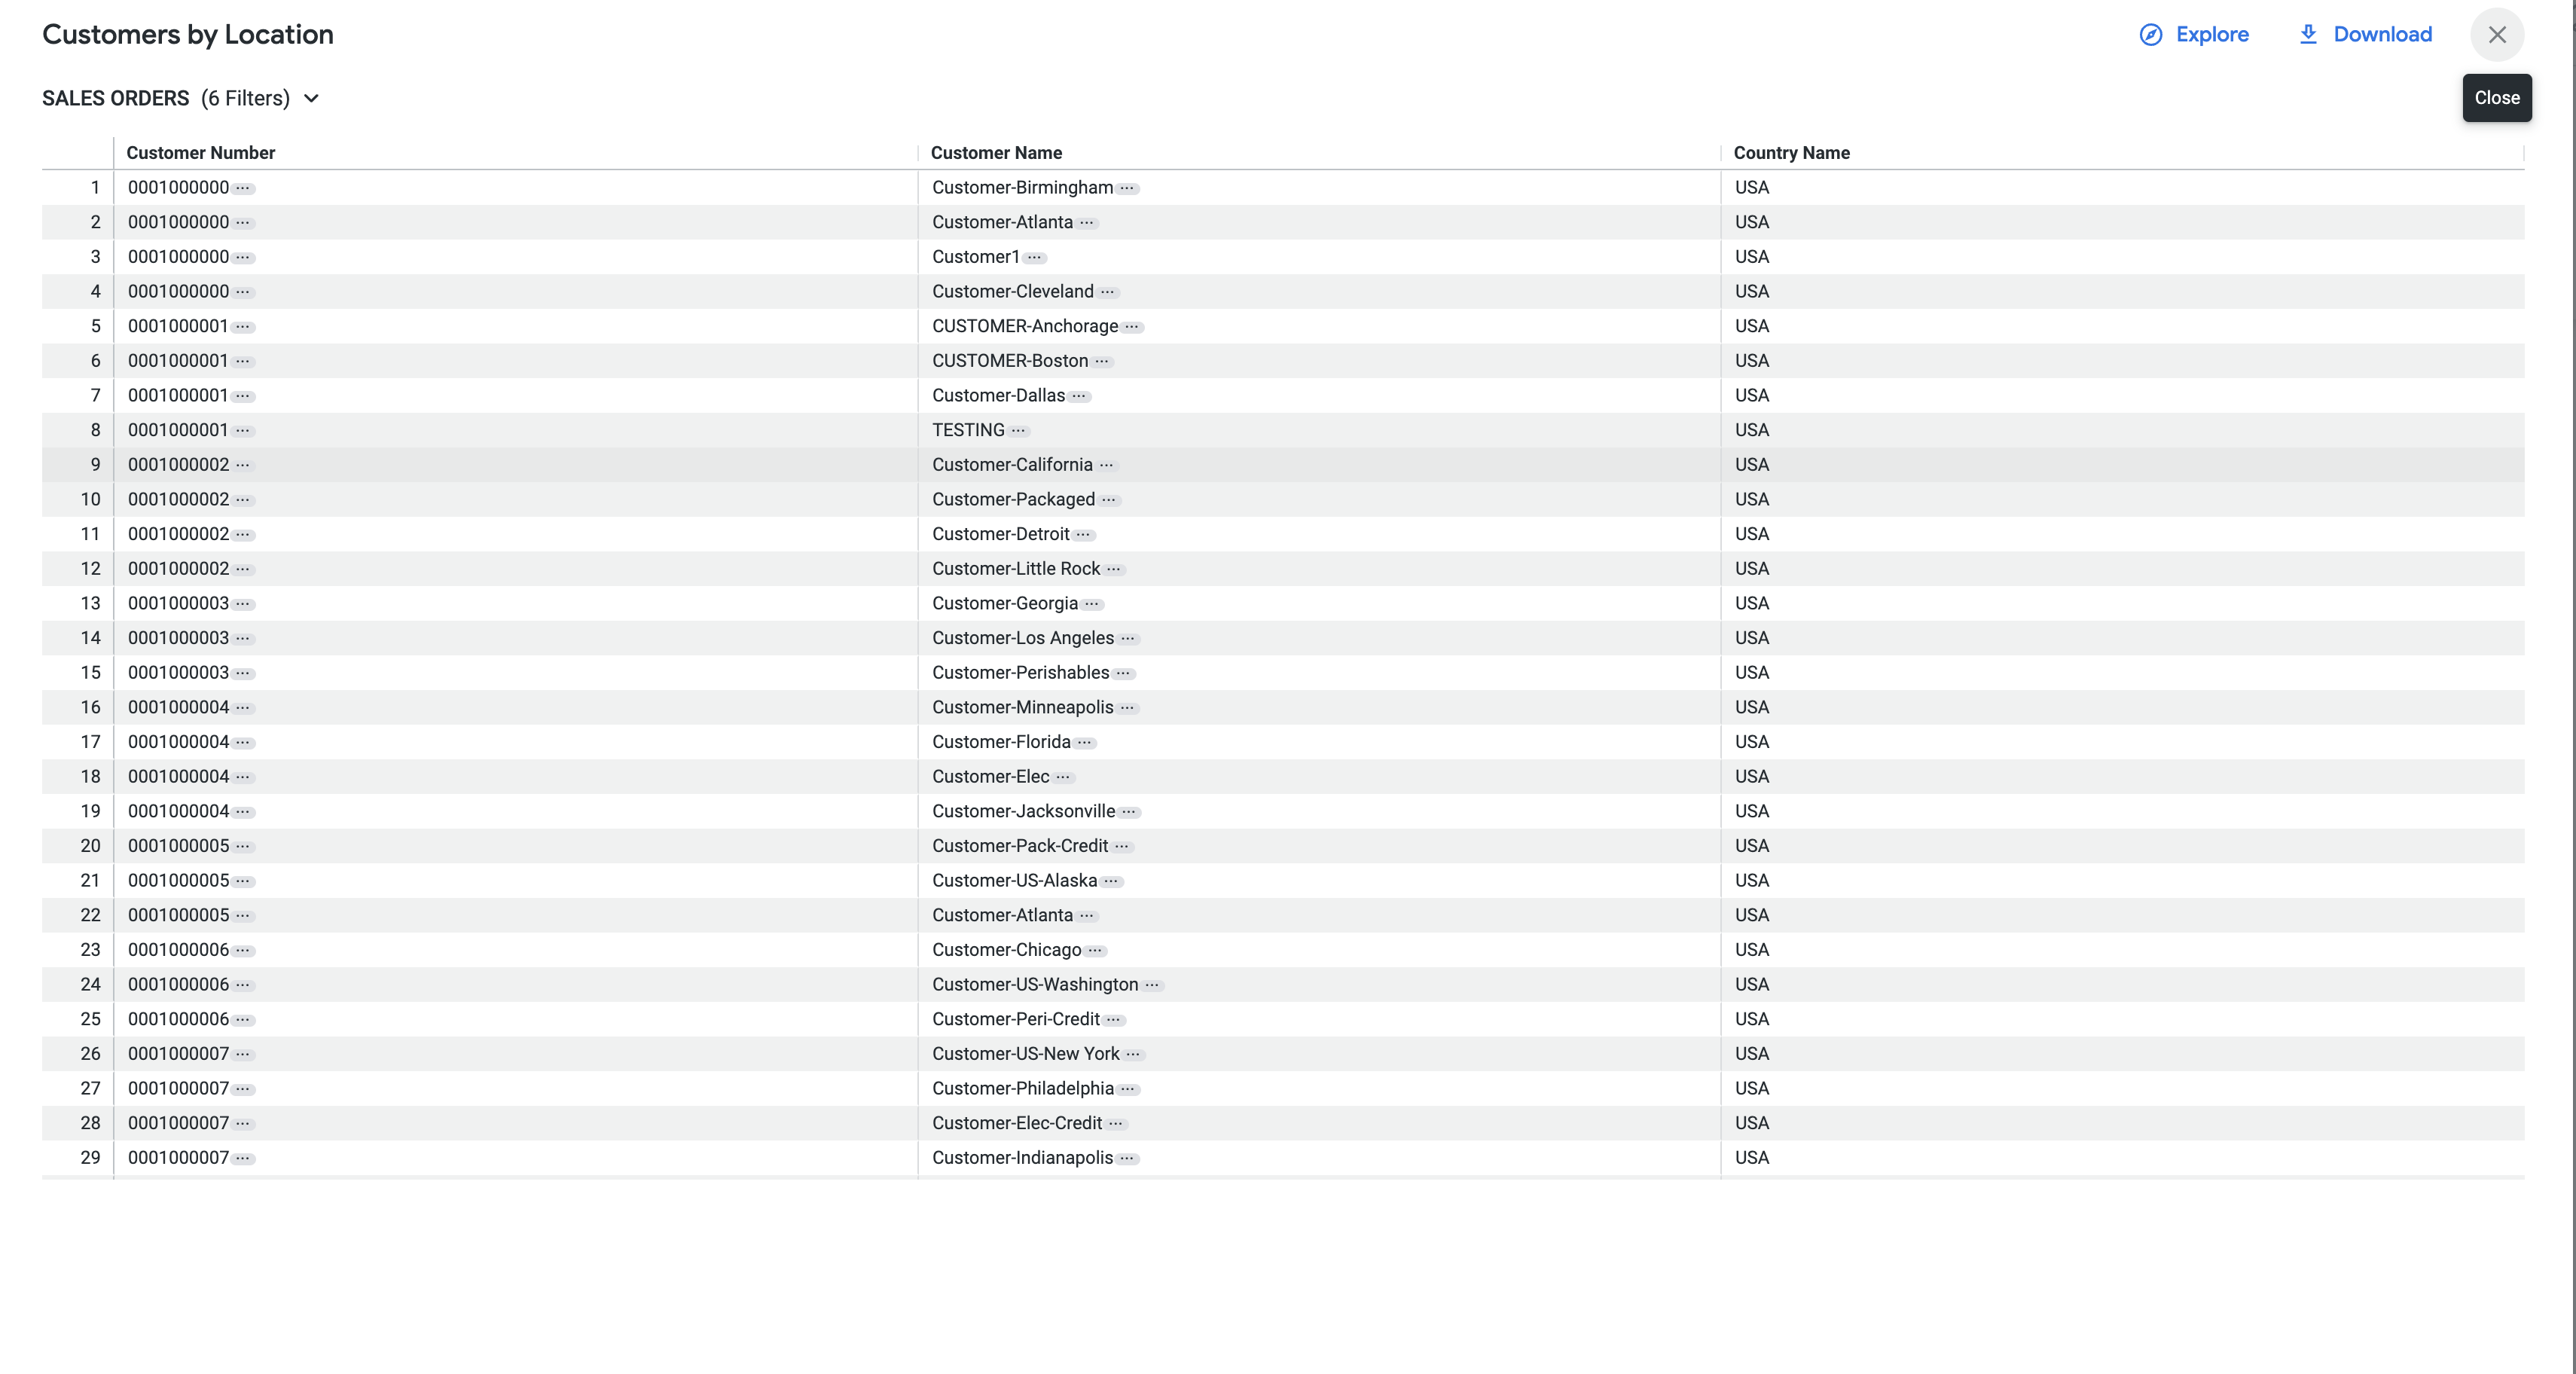
- Find the customer TESTING and click on the three dots (...) next to the name in the Customer Name column.
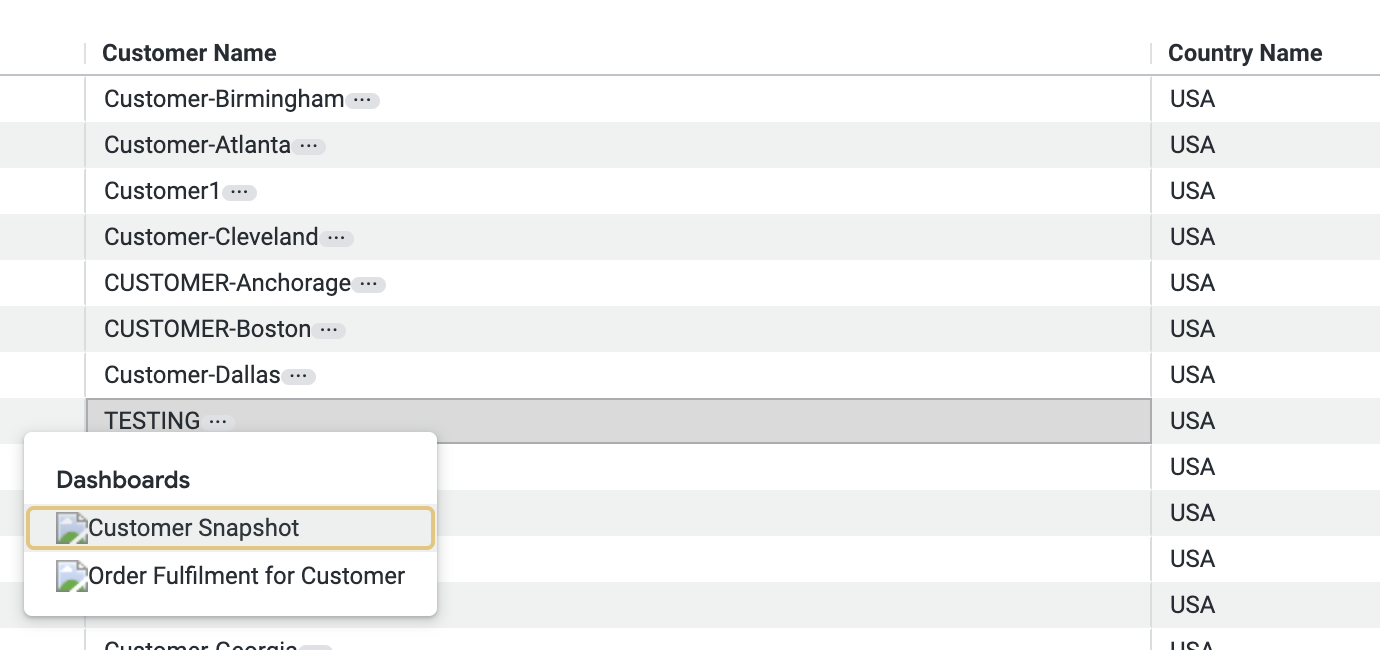
- From the available dashboards in the input selection, select Customer Snapshot. This will open a drill down into customer specific data related to the customer name
TESTING.
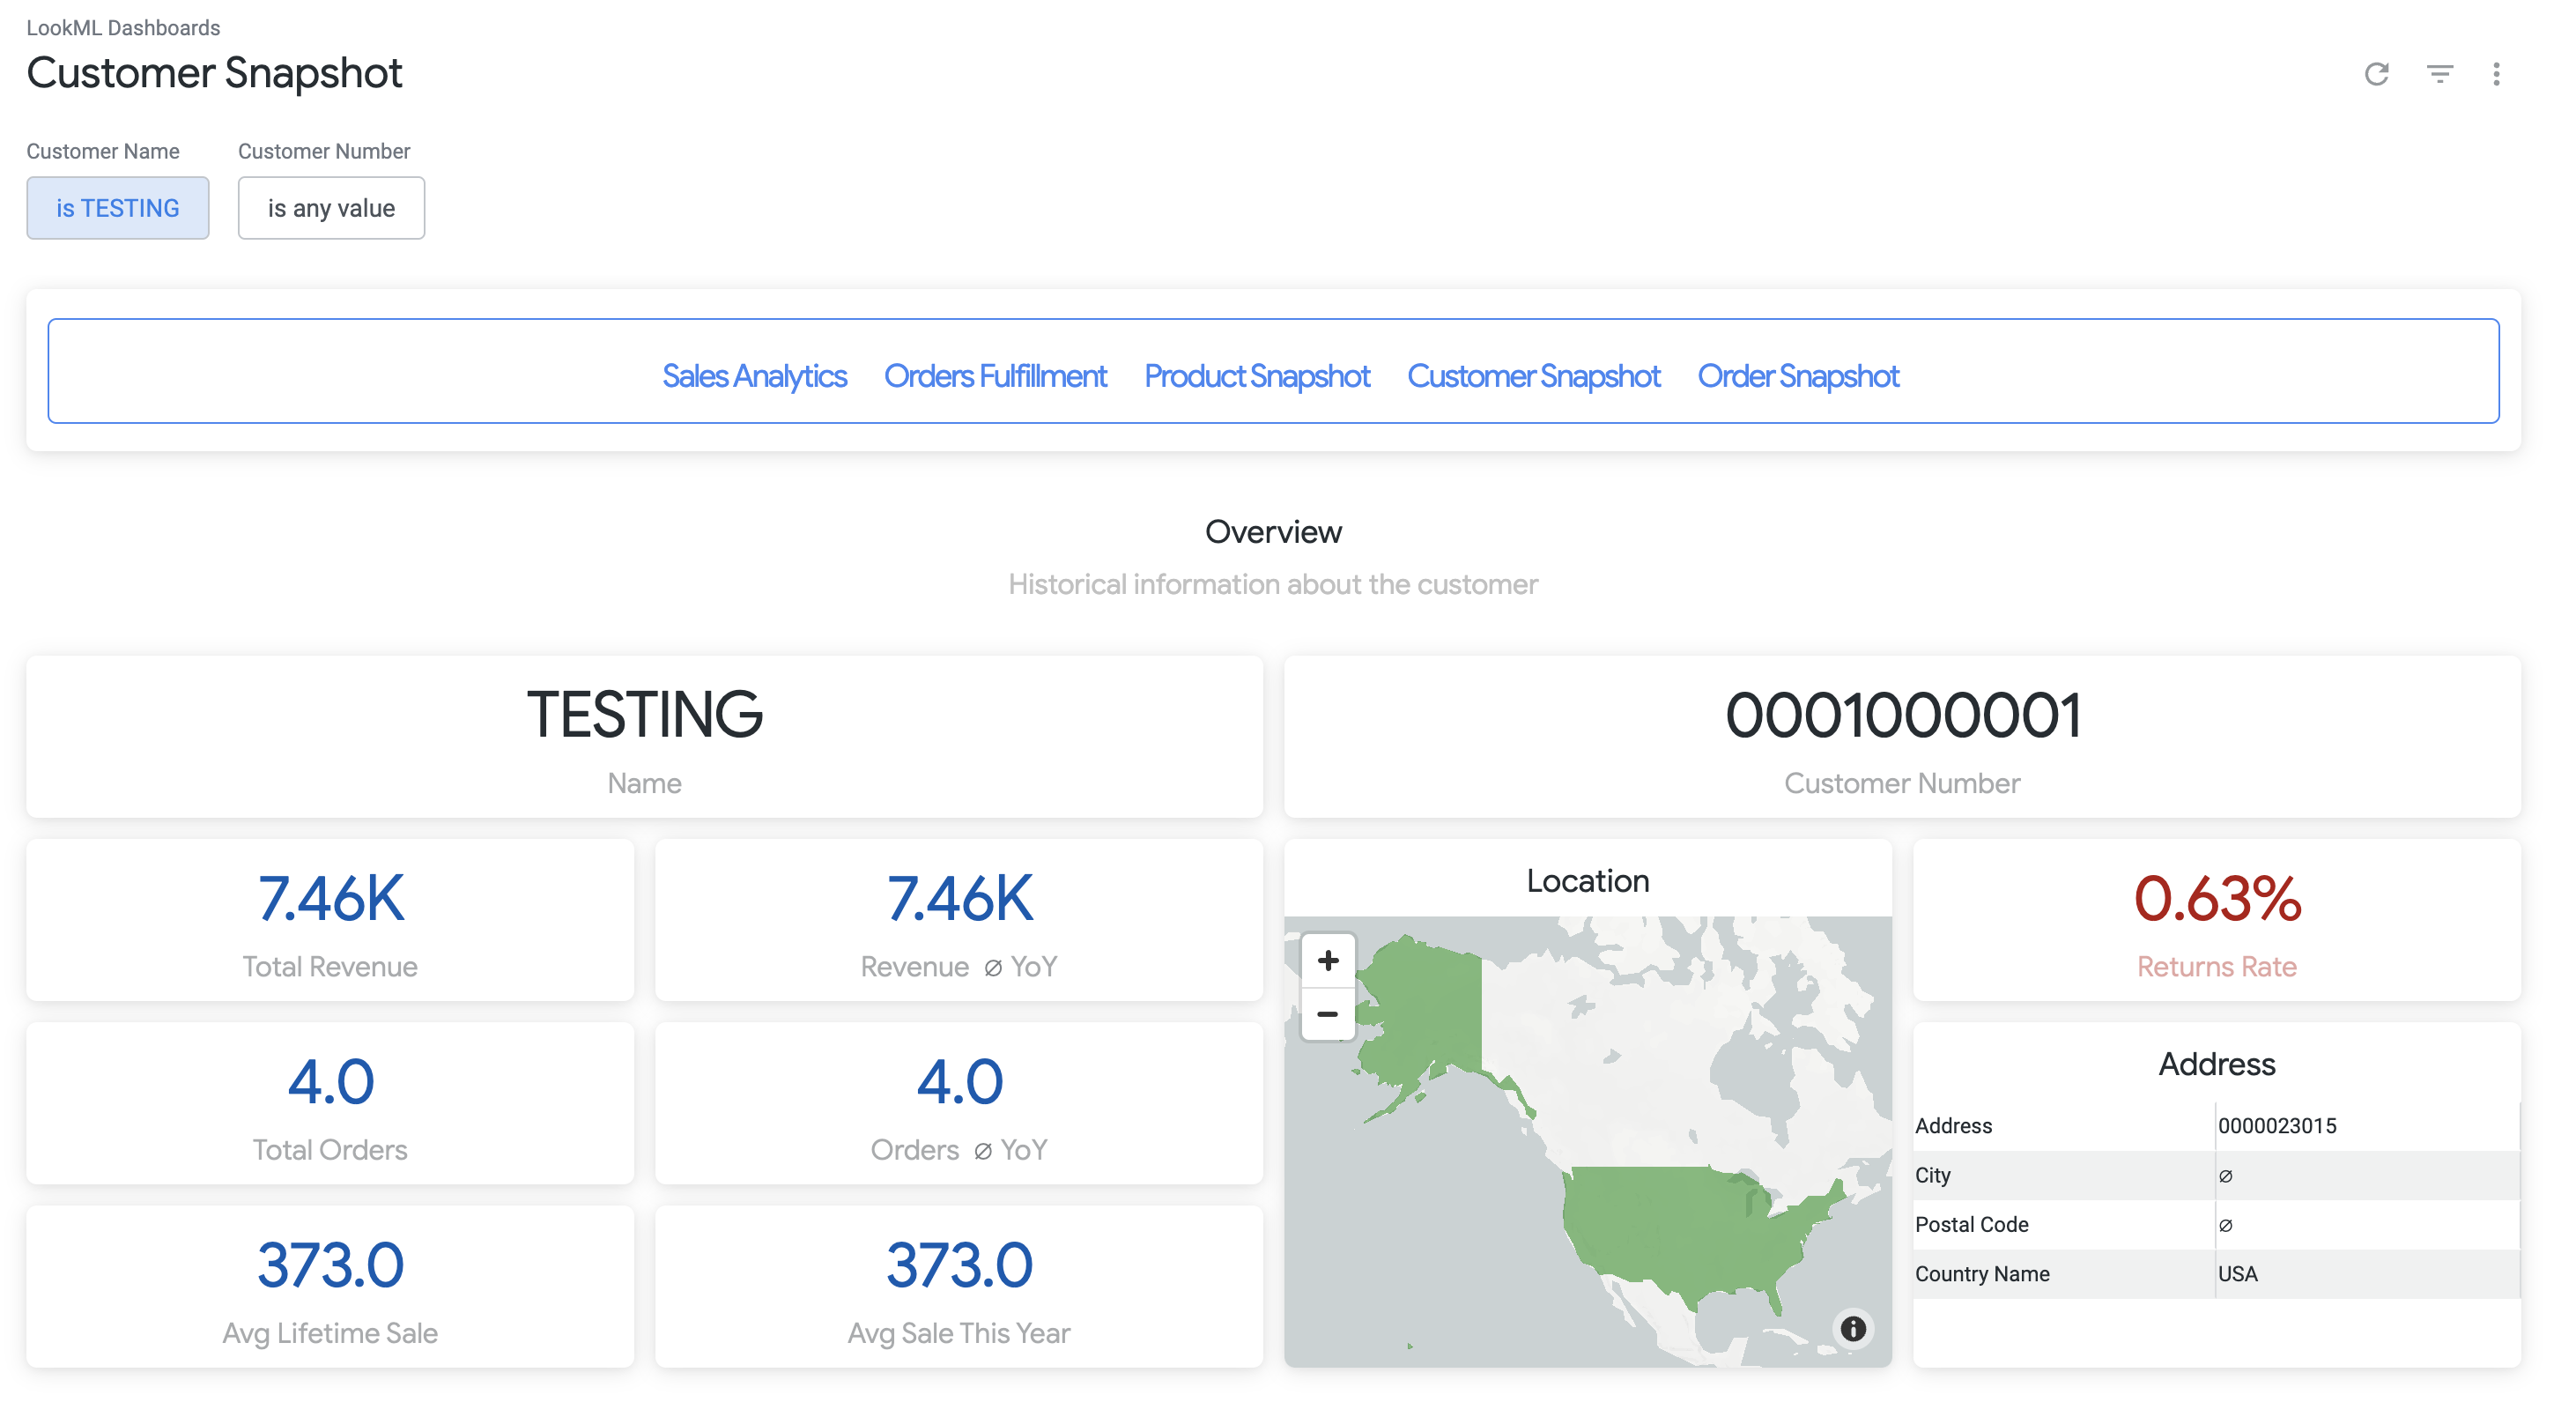
As a business analyst, you can leverage the out of the box reports provided by the SAP Cortex Looker Block to understand more about the state of the business and specific customers and products. Learn more about how to deploy the underlying data at the Cortex Data Foundation GitHub Repository.
Note: If the progress check below is not successful, please wait a few minutes for Looker to populate the query data, and try again.
Click Check my progress to verify the objective.
View sample report data
Solution of Lab