Foundations: Data, Data, Everywhere - Module 3 challenge
A passionate full-stack developer from @ePlus.DEV
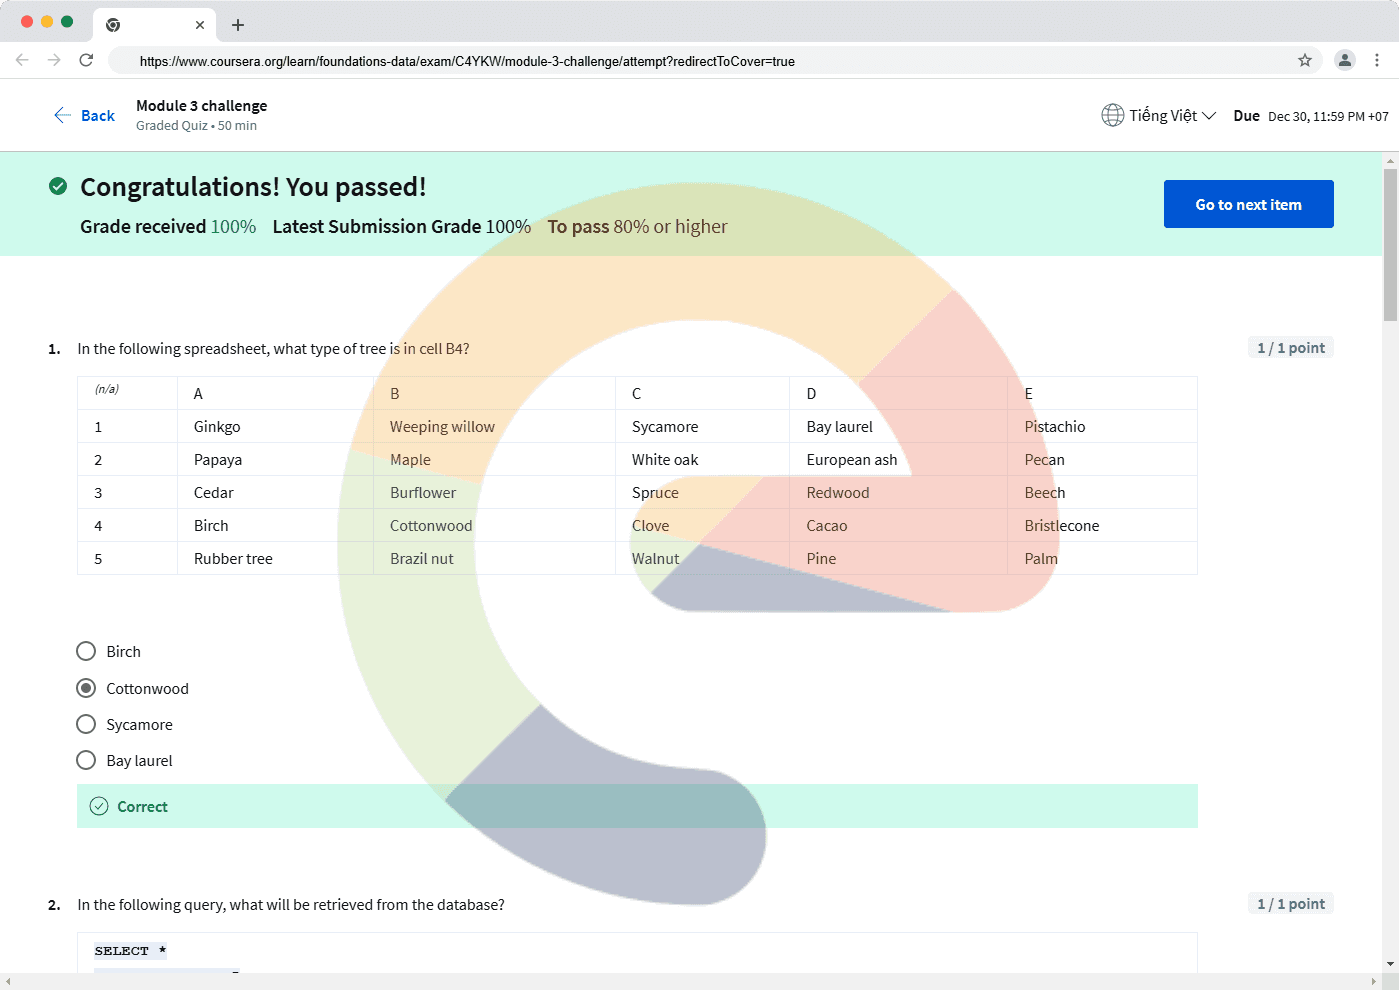
In the following spreadsheet, what type of tree is in cell B4?
(n/a) A B C D E 1 Ginkgo Weeping willow Sycamore Bay laurel Pistachio 2 Papaya Maple White oak European ash Pecan 3 Cedar Burflower Spruce Redwood Beech 4 Birch Cottonwood Clove Cacao Bristlecone 5 Rubber tree Brazil nut Walnut Pine Palm
Birch
Cottonwood
Sycamore
Bay laurel
In the following query, what will be retrieved from the database?
 SELECT *
 FROM Storeroom 5
 WHERE glasses = 'bifocals'
All bifocals in all storerooms
All glasses in all storerooms
All glasses in Storeroom 5 that are bifocals
All glasses in Storeroom 5
Which of the following statements accurately describe spreadsheet attributes and observations? Select all that apply.
An observation includes all of the attributes contained in its row.
An attribute includes all of the observations contained in its row.
Attributes are used to label spreadsheet columns.
A spreadsheet row is also referred to as an observation.
A data professional at a social media company wants to communicate to stakeholders about which countries have the most active users. They create a data visualization that identifies 45 different countries, then shows the number of active users from each one. What type of data visualization should they create?
Line chart
Pie chart
Bar chart
Donut chart
When working in a spreadsheet, what is the correct syntax for a formula that adds the value in cell F9 to the value in cell G9?
=F9+G9
F9,G9
\=F9,G9
F9+G9=
Fill in the blank: The SQL clause
SELECT *is used to retrieve all data from a particular _____.spreadsheet
table
database
cell
In the following query, which clause indicates the table from which to retrieve data?
SELECT *\= ‘stain’
FROM Wood
SELECT *
WHERE finish
Which text wrapping feature cuts off the contents of a spreadsheet cell so only the text that fits is visible?
Wrap
Fill
Overflow
Clip
Which of the following statements accurately describe data visualizations and visualization tools? Select all that apply.
Spreadsheets have visualization tools that enable data professionals to create line or bar charts.
When working with the programming language R, an integrated developer environment enables the creation of data visualizations.
Tableau makes it possible to integrate data into dashboard-style visualizations.
The process used for analyzing the data should not influence the type of visualization ultimately selected.
A data professional wants the data in column A to be in alphabetical order from A to Z. What spreadsheet feature would enable them to accomplish this task?
(n/a)
A
B
C
1
Deciani
Lin
33
2
Roberts
Jeremy
28
3
Storelli
Hyun
64
4
Piotrowski
Sook
84
5
Mondek
Priscilla
42
6
Lam
April
96
Formatting
Chart editor
Sort range
Dragging