Table of Contents
Overview
In this lab you will learn about the features and tools provided by Cloud Logging to gain insight of your applications.
What you'll learn
How to use Cloud Logging effectively and get insight about applications running on GKE
How to effectively build and run queries using log analytics
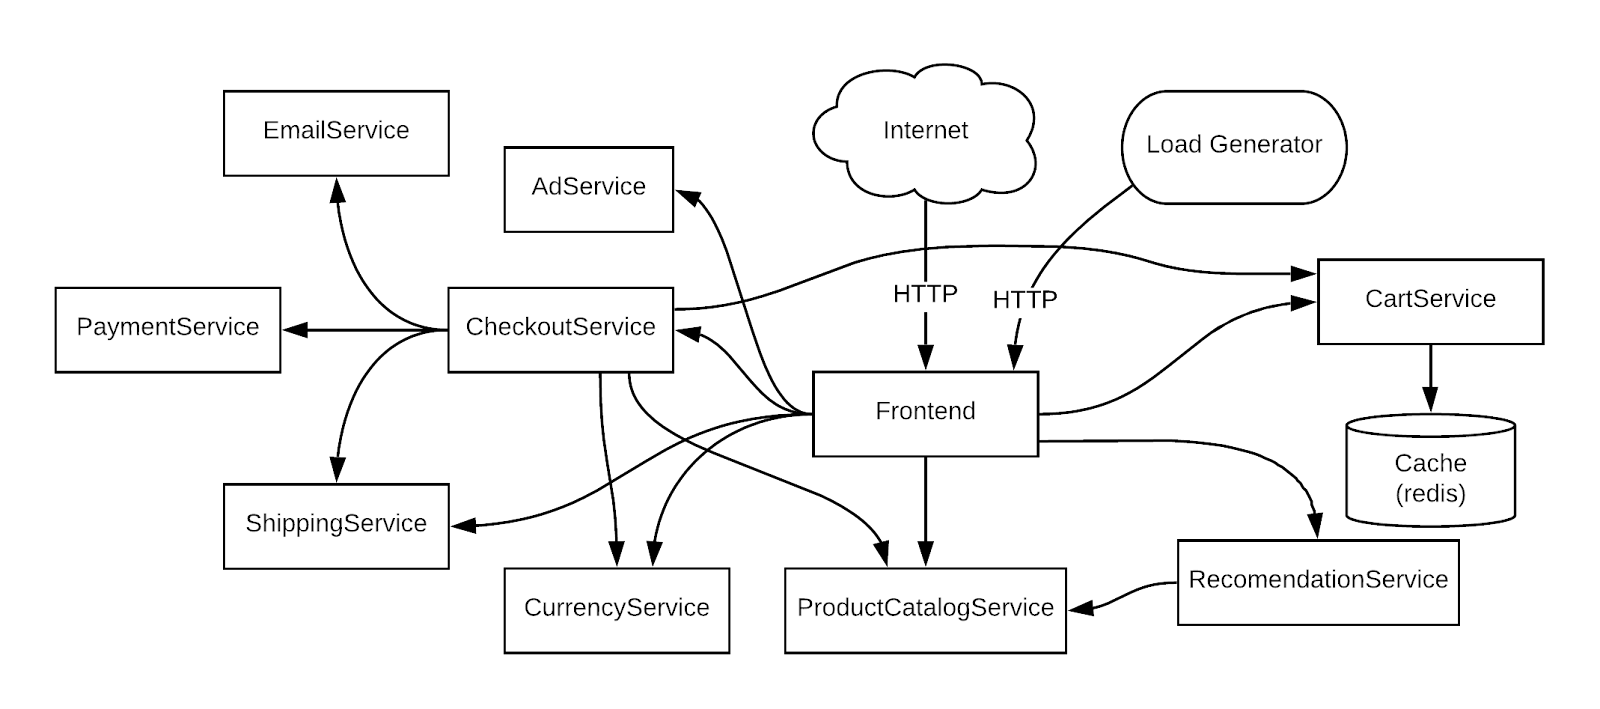
The demo application used in the lab
To use a concrete example, you will work through a scenario based on this microservices demo sample app deployed to a GKE cluster. In this demo app, there are many microservices and dependencies among them.
Setup and Requirements
Before you click the Start Lab button
Read these instructions. Labs are timed and you cannot pause them. The timer, which starts when you click Start Lab, shows how long Google Cloud resources will be made available to you.
This hands-on lab lets you do the lab activities yourself in a real cloud environment, not in a simulation or demo environment. It does so by giving you new, temporary credentials that you use to sign in and access Google Cloud for the duration of the lab.
To complete this lab, you need:
- Access to a standard internet browser (Chrome browser recommended).
Note: Use an Incognito or private browser window to run this lab. This prevents any conflicts between your personal account and the Student account, which may cause extra charges incurred to your personal account.
- Time to complete the lab---remember, once you start, you cannot pause a lab.
Note: If you already have your own personal Google Cloud account or project, do not use it for this lab to avoid extra charges to your account.
How to start your lab and sign in to the Google Cloud console
Click the Start Lab button. If you need to pay for the lab, a pop-up opens for you to select your payment method. On the left is the Lab Details panel with the following:
The Open Google Cloud console button
Time remaining
The temporary credentials that you must use for this lab
Other information, if needed, to step through this lab
Click Open Google Cloud console (or right-click and select Open Link in Incognito Window if you are running the Chrome browser).
The lab spins up resources, and then opens another tab that shows the Sign in page.
Tip: Arrange the tabs in separate windows, side-by-side.
Note: If you see the Choose an account dialog, click Use Another Account.
If necessary, copy the Username below and paste it into the Sign in dialog.
student-04-092037832b95@qwiklabs.netYou can also find the Username in the Lab Details panel.
Click Next.
Copy the Password below and paste it into the Welcome dialog.
NLHiSBRU72LYYou can also find the Password in the Lab Details panel.
Click Next.
Important: You must use the credentials the lab provides you. Do not use your Google Cloud account credentials.
Note: Using your own Google Cloud account for this lab may incur extra charges.
Click through the subsequent pages:
Accept the terms and conditions.
Do not add recovery options or two-factor authentication (because this is a temporary account).
Do not sign up for free trials.
After a few moments, the Google Cloud console opens in this tab.
Note: To view a menu with a list of Google Cloud products and services, click the Navigation menu at the top-left.
Activate Cloud Shell
Cloud Shell is a virtual machine that is loaded with development tools. It offers a persistent 5GB home directory and runs on the Google Cloud. Cloud Shell provides command-line access to your Google Cloud resources.
Click Activate Cloud Shell
at the top of the Google Cloud console.
When you are connected, you are already authenticated, and the project is set to your Project_ID, qwiklabs-gcp-03-57b96a44bfe3. The output contains a line that declares the Project_ID for this session:
Your Cloud Platform project in this session is set to qwiklabs-gcp-03-57b96a44bfe3
gcloud is the command-line tool for Google Cloud. It comes pre-installed on Cloud Shell and supports tab-completion.
- (Optional) You can list the active account name with this command:
gcloud auth list
- Click Authorize.
Output:
ACTIVE: *
ACCOUNT: student-04-092037832b95@qwiklabs.net

To set the active account, run:
    $ gcloud config set account `ACCOUNT`
- (Optional) You can list the project ID with this command:
gcloud config list project
Output:
[core]
project = qwiklabs-gcp-03-57b96a44bfe3
Note: For full documentation of gcloud, in Google Cloud, refer to the gcloud CLI overview guide.
Task 1. Infrastructure setup
Verify the GKE cluster
Connect to a Google Kubernetes Engine cluster and validate that it's been created correctly.
1.In Cloud Shell, set the zone in gcloud:
gcloud config set compute/zone us-east4-c
- Use the following command to see the cluster's status:
gcloud container clusters list
You should see a similar status:
NAME: day2-ops
LOCATION: us-east4-c
MASTER_VERSION: 1.24.3-gke.2100
MASTER_IP: 34.68.183.6
MACHINE_TYPE: e2-standard-2
NODE_VERSION: 1.24.3-gke.2100
NUM_NODES: 4
STATUS: RUNNING
The cluster status will say RUNNING. If it's still PROVISIONING, wait a moment and run the command above again. Repeat until the status is RUNNING.
You can also check the progress in the Cloud Console - Navigation menu > Kubernetes Engine > Clusters.
- Once your cluster has RUNNING status, get the cluster credentials:
gcloud container clusters get-credentials day2-ops --region us-east4
(Output)
Fetching cluster endpoint and auth data.
kubeconfig entry generated for day2-ops.
- Verify that the nodes have been created:
kubectl get nodes
Your output should look like this:
NAME                                      STATUS   ROLES    AGE     VERSION
gke-day2-ops-default-pool-b3081059-bskv   Ready    <none>   3m32s   v1.24.3-gke.2100
gke-day2-ops-default-pool-b3081059-dt73   Ready    <none>   3m30s   v1.24.3-gke.2100
gke-day2-ops-default-pool-b3081059-g1m3   Ready    <none>   3m31s   v1.24.3-gke.2100
gke-day2-ops-default-pool-b3081059-wq4b   Ready    <none>   3m31s   v1.24.3-gke.2100
Task 2. Deploy application
Next, you will deploy a microservices application called Online Boutique to your cluster to create an actual workload you can monitor.
- Run the following to clone the repo:
git clone https://github.com/GoogleCloudPlatform/microservices-demo.git
- Change to the
microservices-demodirectory:
cd microservices-demo
- Install the app using
kubectl:
kubectl apply -f release/kubernetes-manifests.yaml
- Confirm everything is running correctly:
kubectl get pods
The output should look similar to the output below. Re-run the command until all pods are reporting a Running status before moving to the next step.
NAME                                     READY     STATUS    RESTARTS   AGE
adservice-55f94cfd9c-4lvml               1/1       Running   0          20m
cartservice-6f4946f9b8-6wtff             1/1       Running   2          20m
checkoutservice-5688779d8c-l6crl         1/1       Running   0          20m
currencyservice-665d6f4569-b4sbm         1/1       Running   0          20m
emailservice-684c89bcb8-h48sq            1/1       Running   0          20m
frontend-67c8475b7d-vktsn                1/1       Running   0          20m
loadgenerator-6d646566db-p422w           1/1       Running   0          20m
paymentservice-858d89d64c-hmpkg          1/1       Running   0          20m
productcatalogservice-bcd85cb5-d6xp4     1/1       Running   0          20m
recommendationservice-685d7d6cd9-pxd9g   1/1       Running   0          20m
redis-cart-9b864d47f-c9xc6               1/1       Running   0          20m
shippingservice-5948f9fb5c-vndcp         1/1       Running   0          20m
- Run the following to get the external IP of the application. An IP address is only returned once the service has been deployed. So, you may need to repeat the commands until there's an external IP address assigned:
export EXTERNAL_IP=$(kubectl get service frontend-external -o jsonpath="{.status.loadBalancer.ingress[0].ip}")
echo $EXTERNAL_IP
(Example output)
35.222.235.86
- Finally, confirm that the app is up and running:
curl -o /dev/null -s -w "%{http_code}\n" http://${EXTERNAL_IP}
Your confirmation will look like this:
200
After the application is deployed, you can also go to the Cloud Console and view the status.
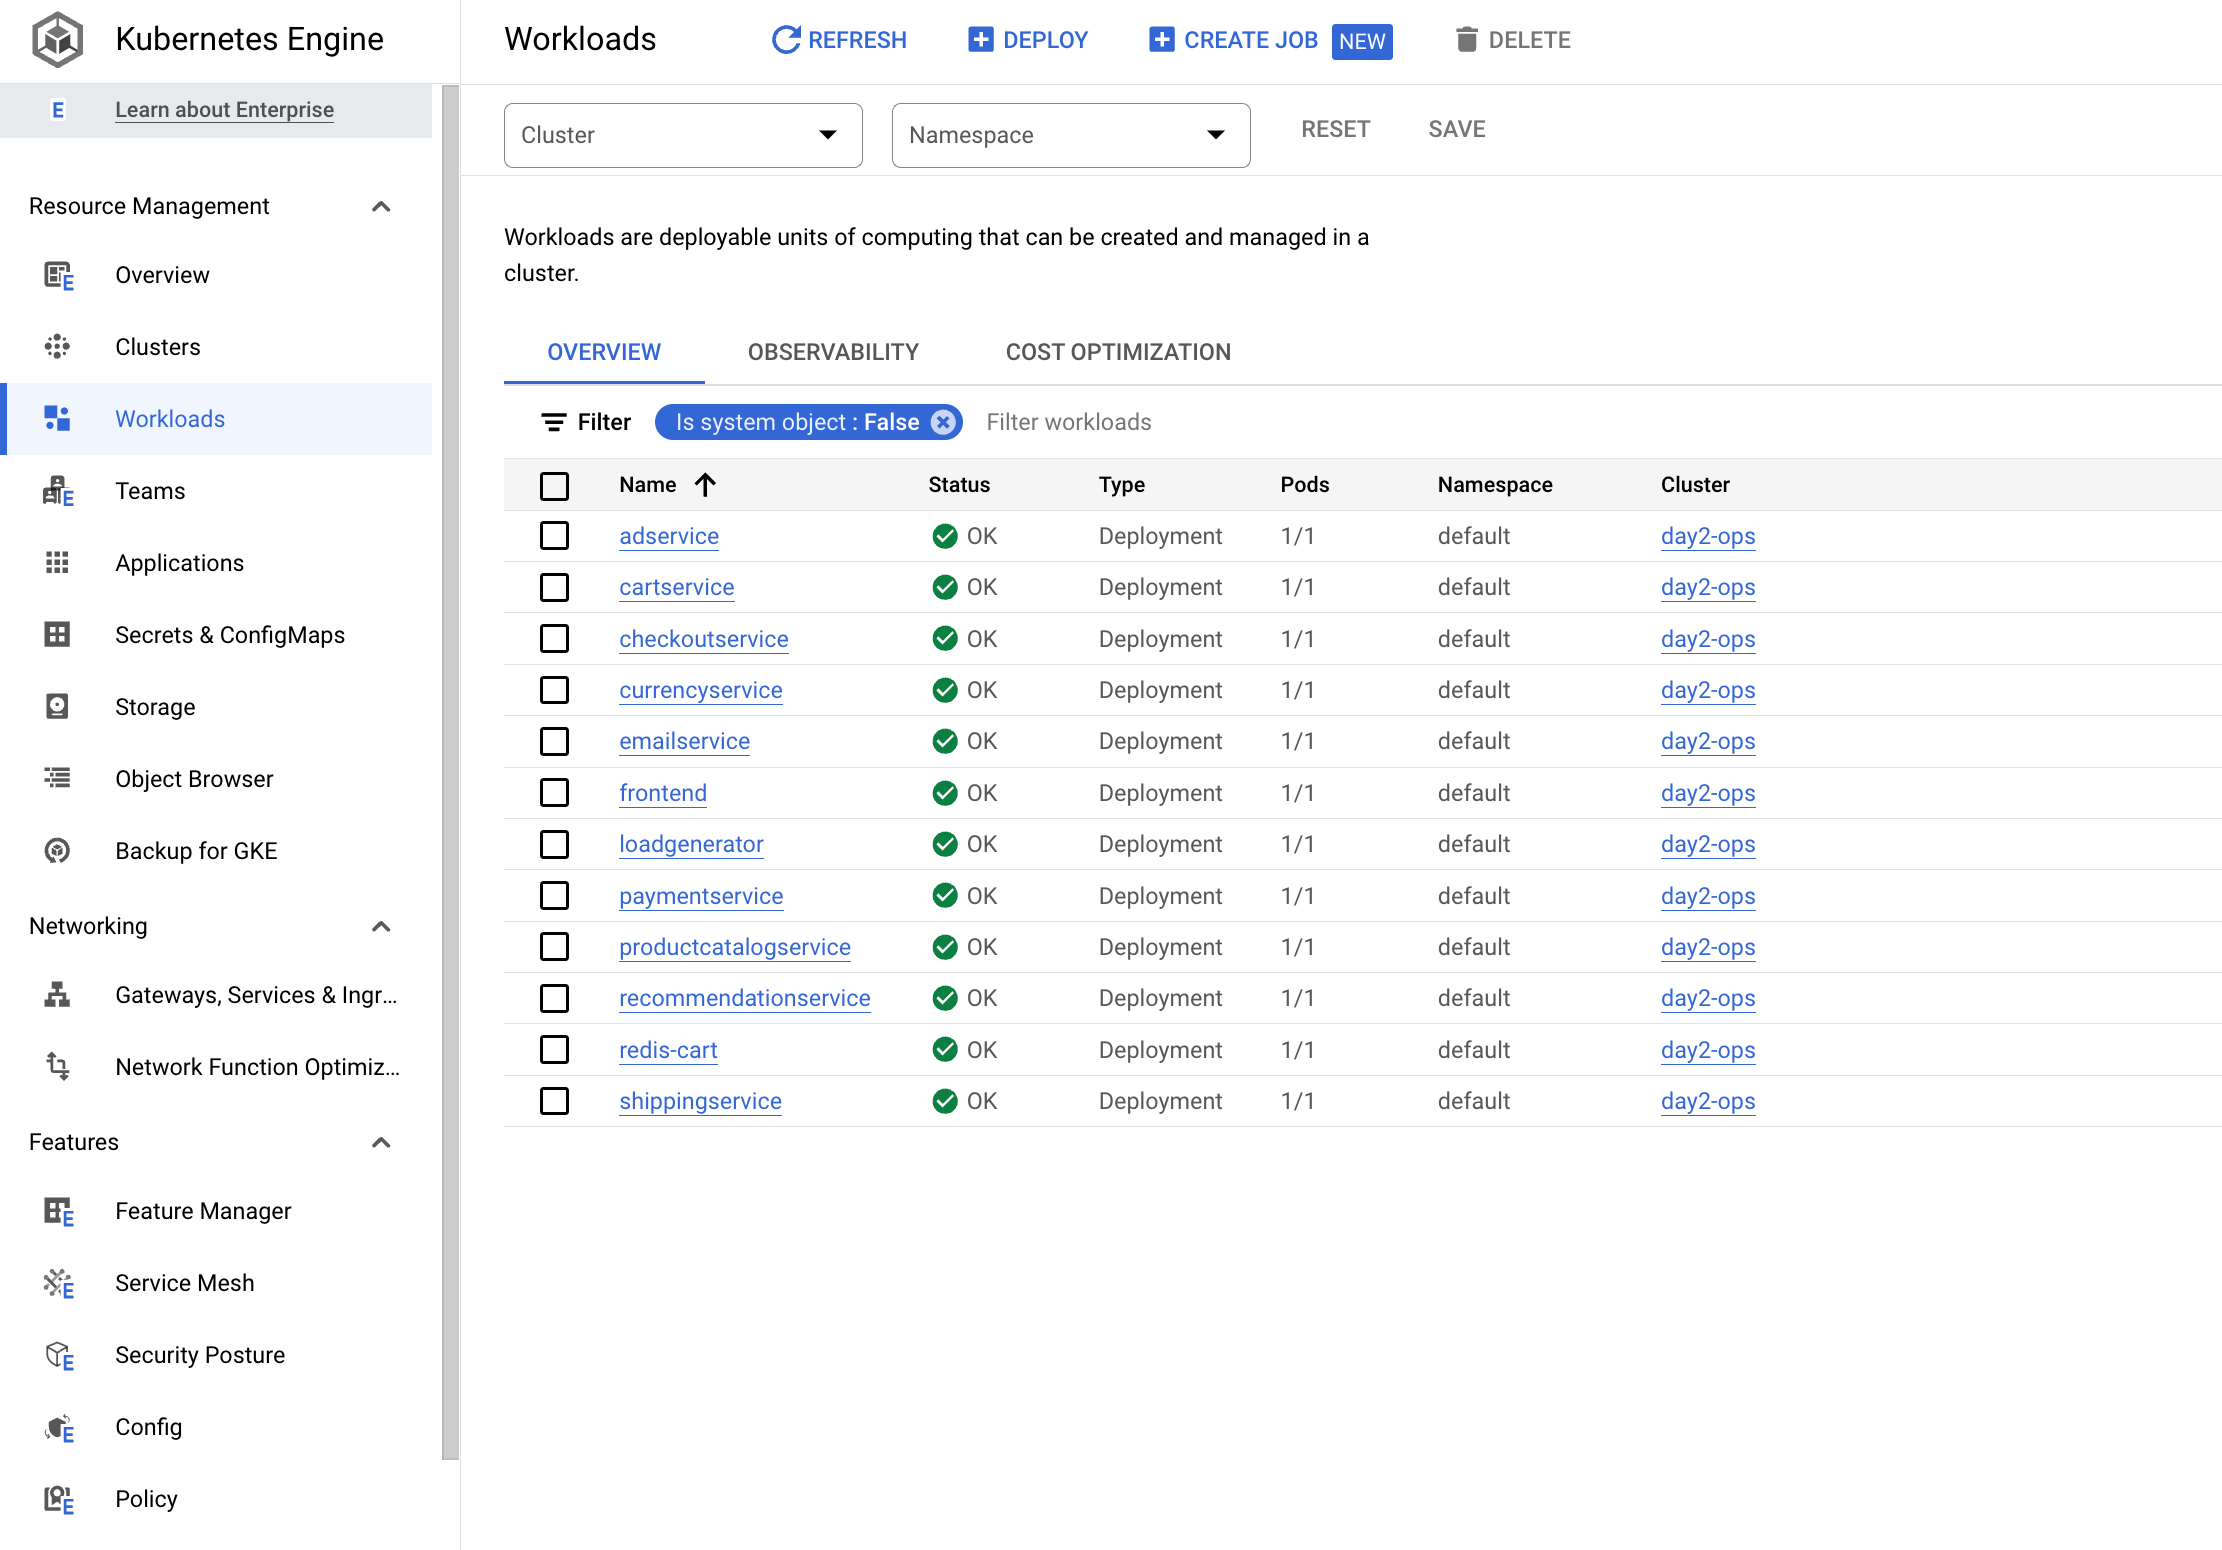
- In the Kubernetes Engine > Workloads page you'll see that all the pods are OK.
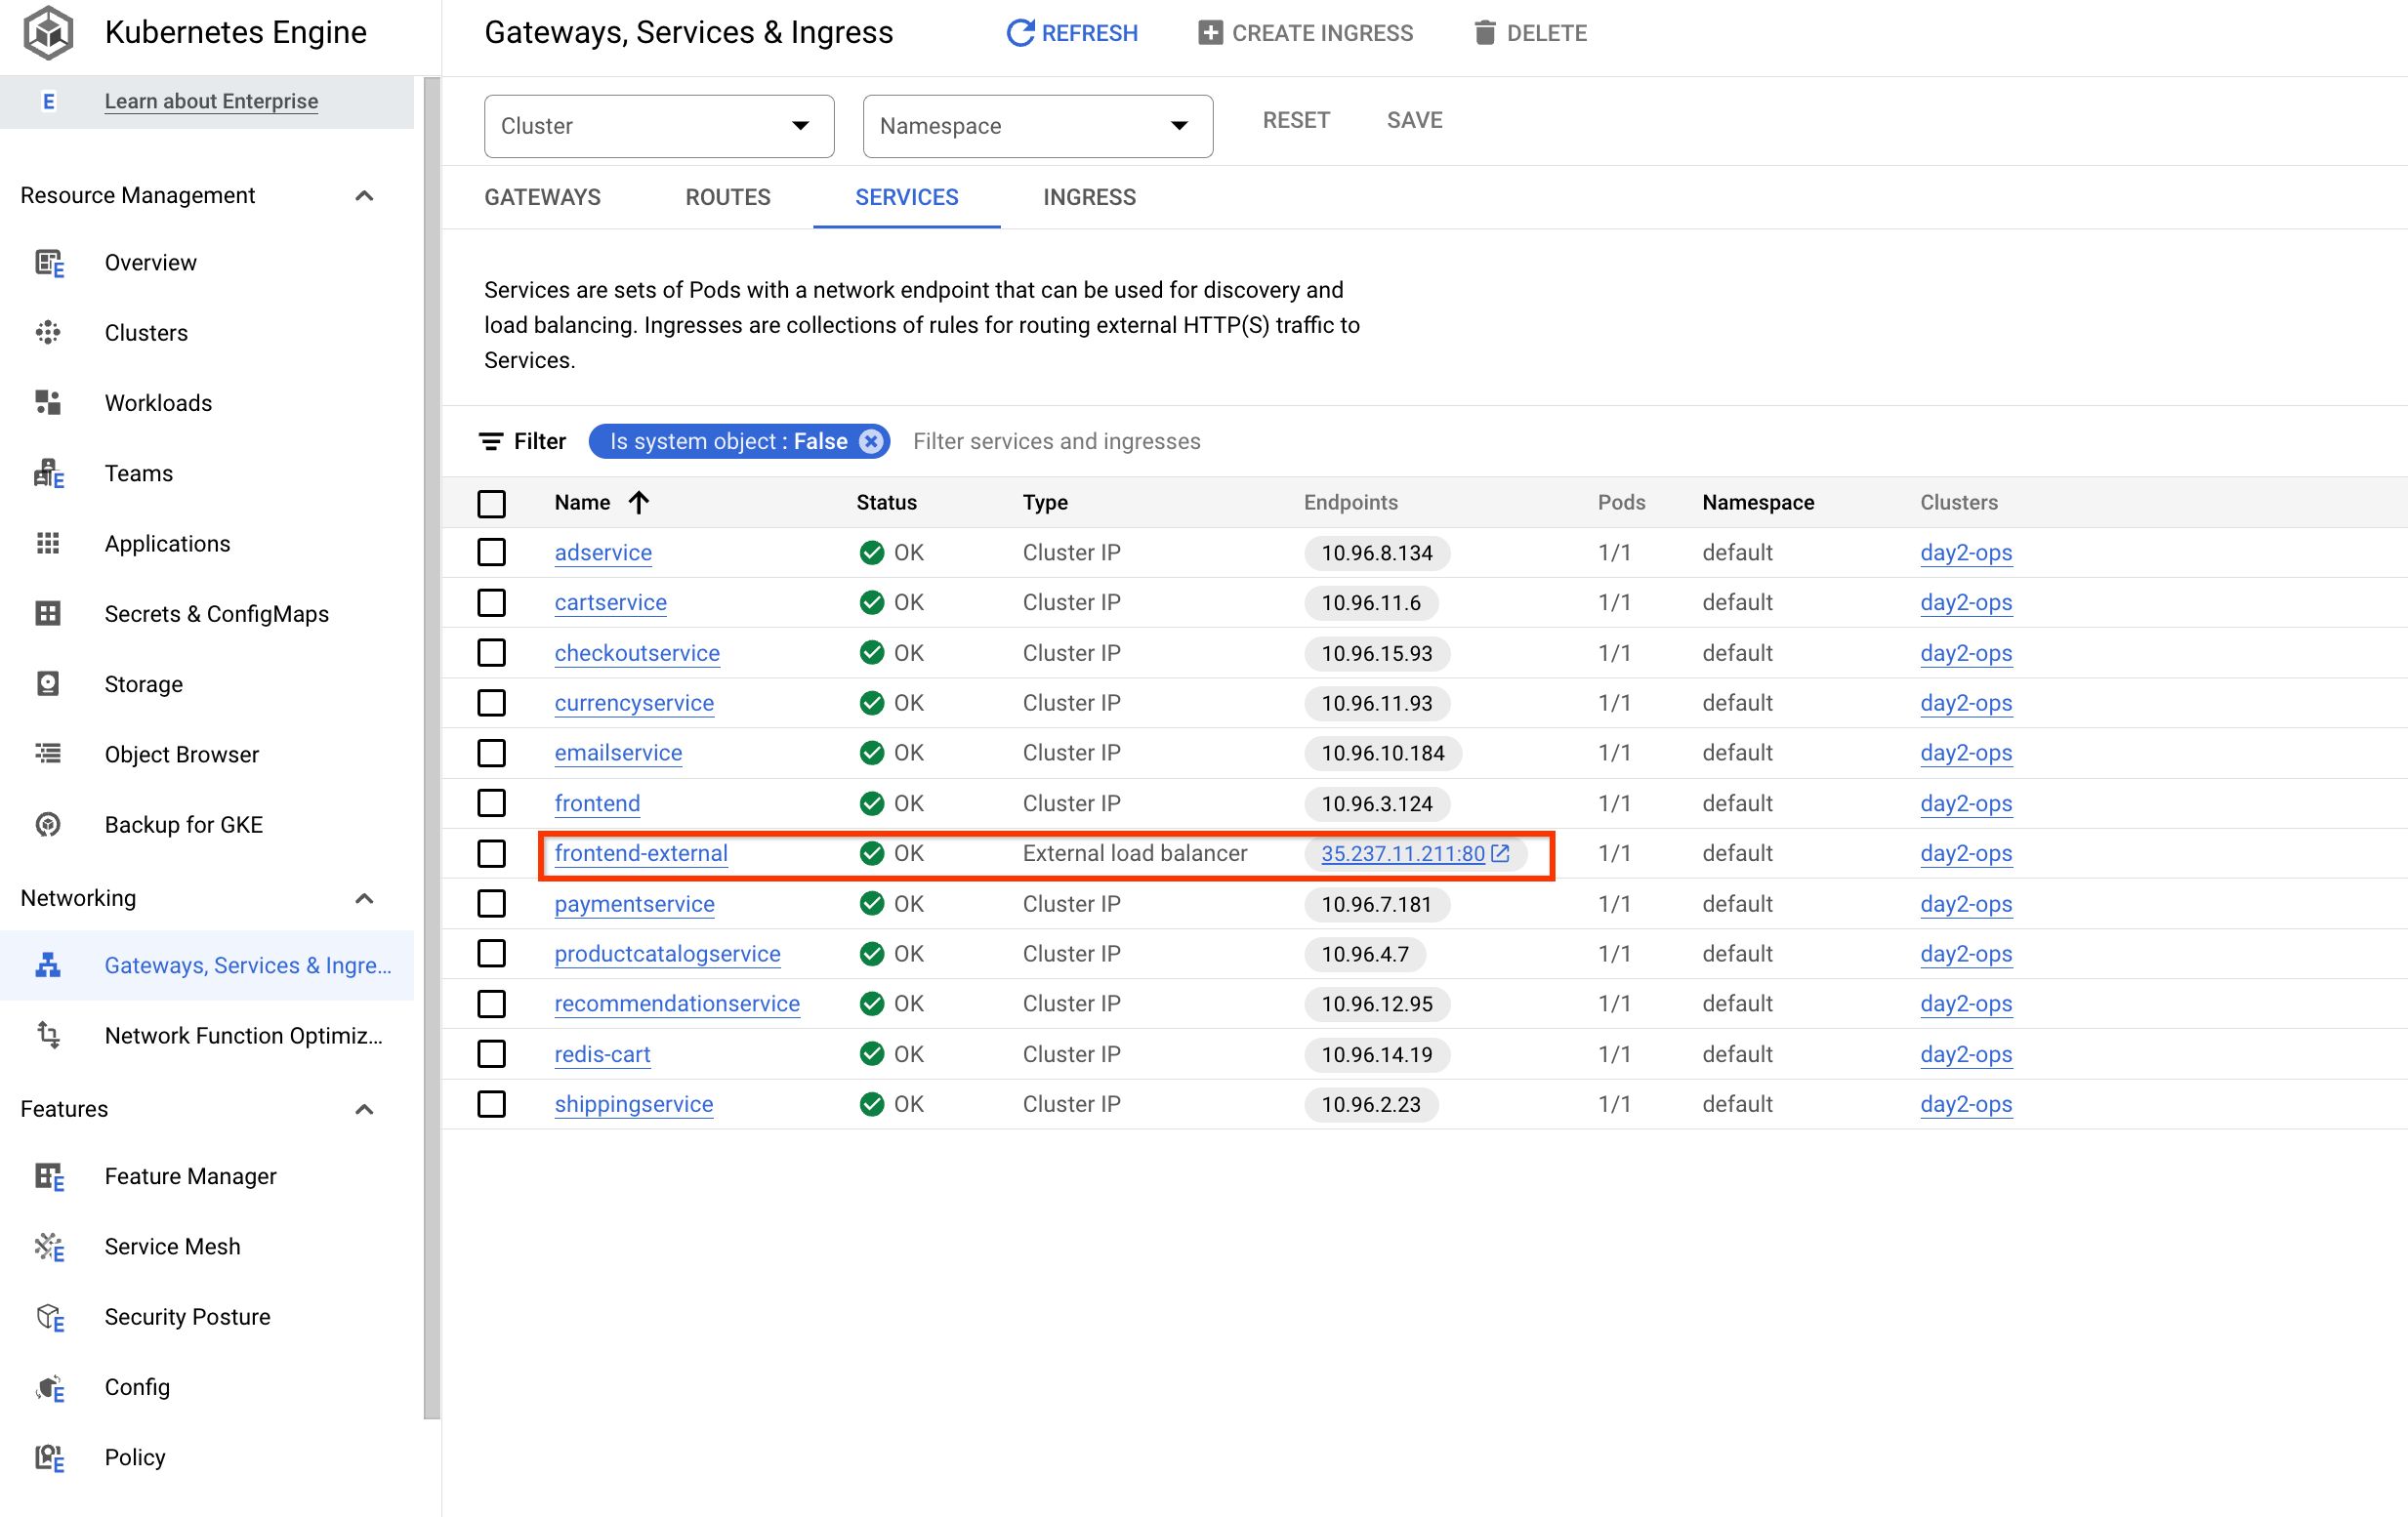
- Now click Gateways, Services & Ingress, verify that all services are OK.
Open the application
Under Gateways, Services & Ingress, click the Endpoint IP of the service frontend-external:
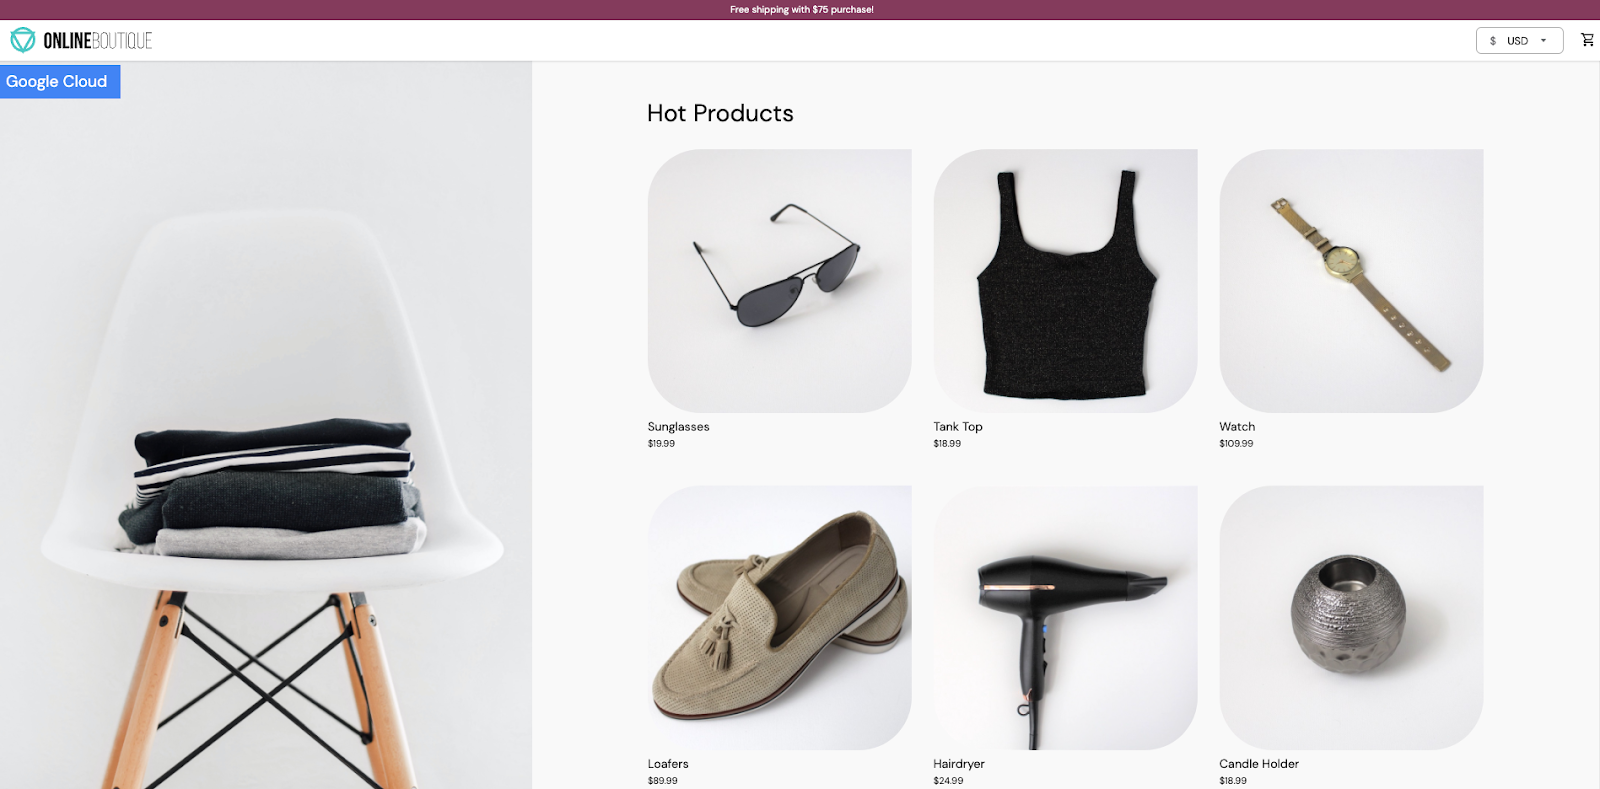
It should open the application and you will have a page like the following:
Click Check my progress to verify the objective.
Deploy application
Check my progress
Task 3. Manage log buckets
There are two ways you can enable Log Analytics. One way is to upgrade an existing bucket. The other is to create a new log bucket with Log Analytics enabled.
Upgrade an existing bucket
You can use the following steps to upgrade an existing log bucket.
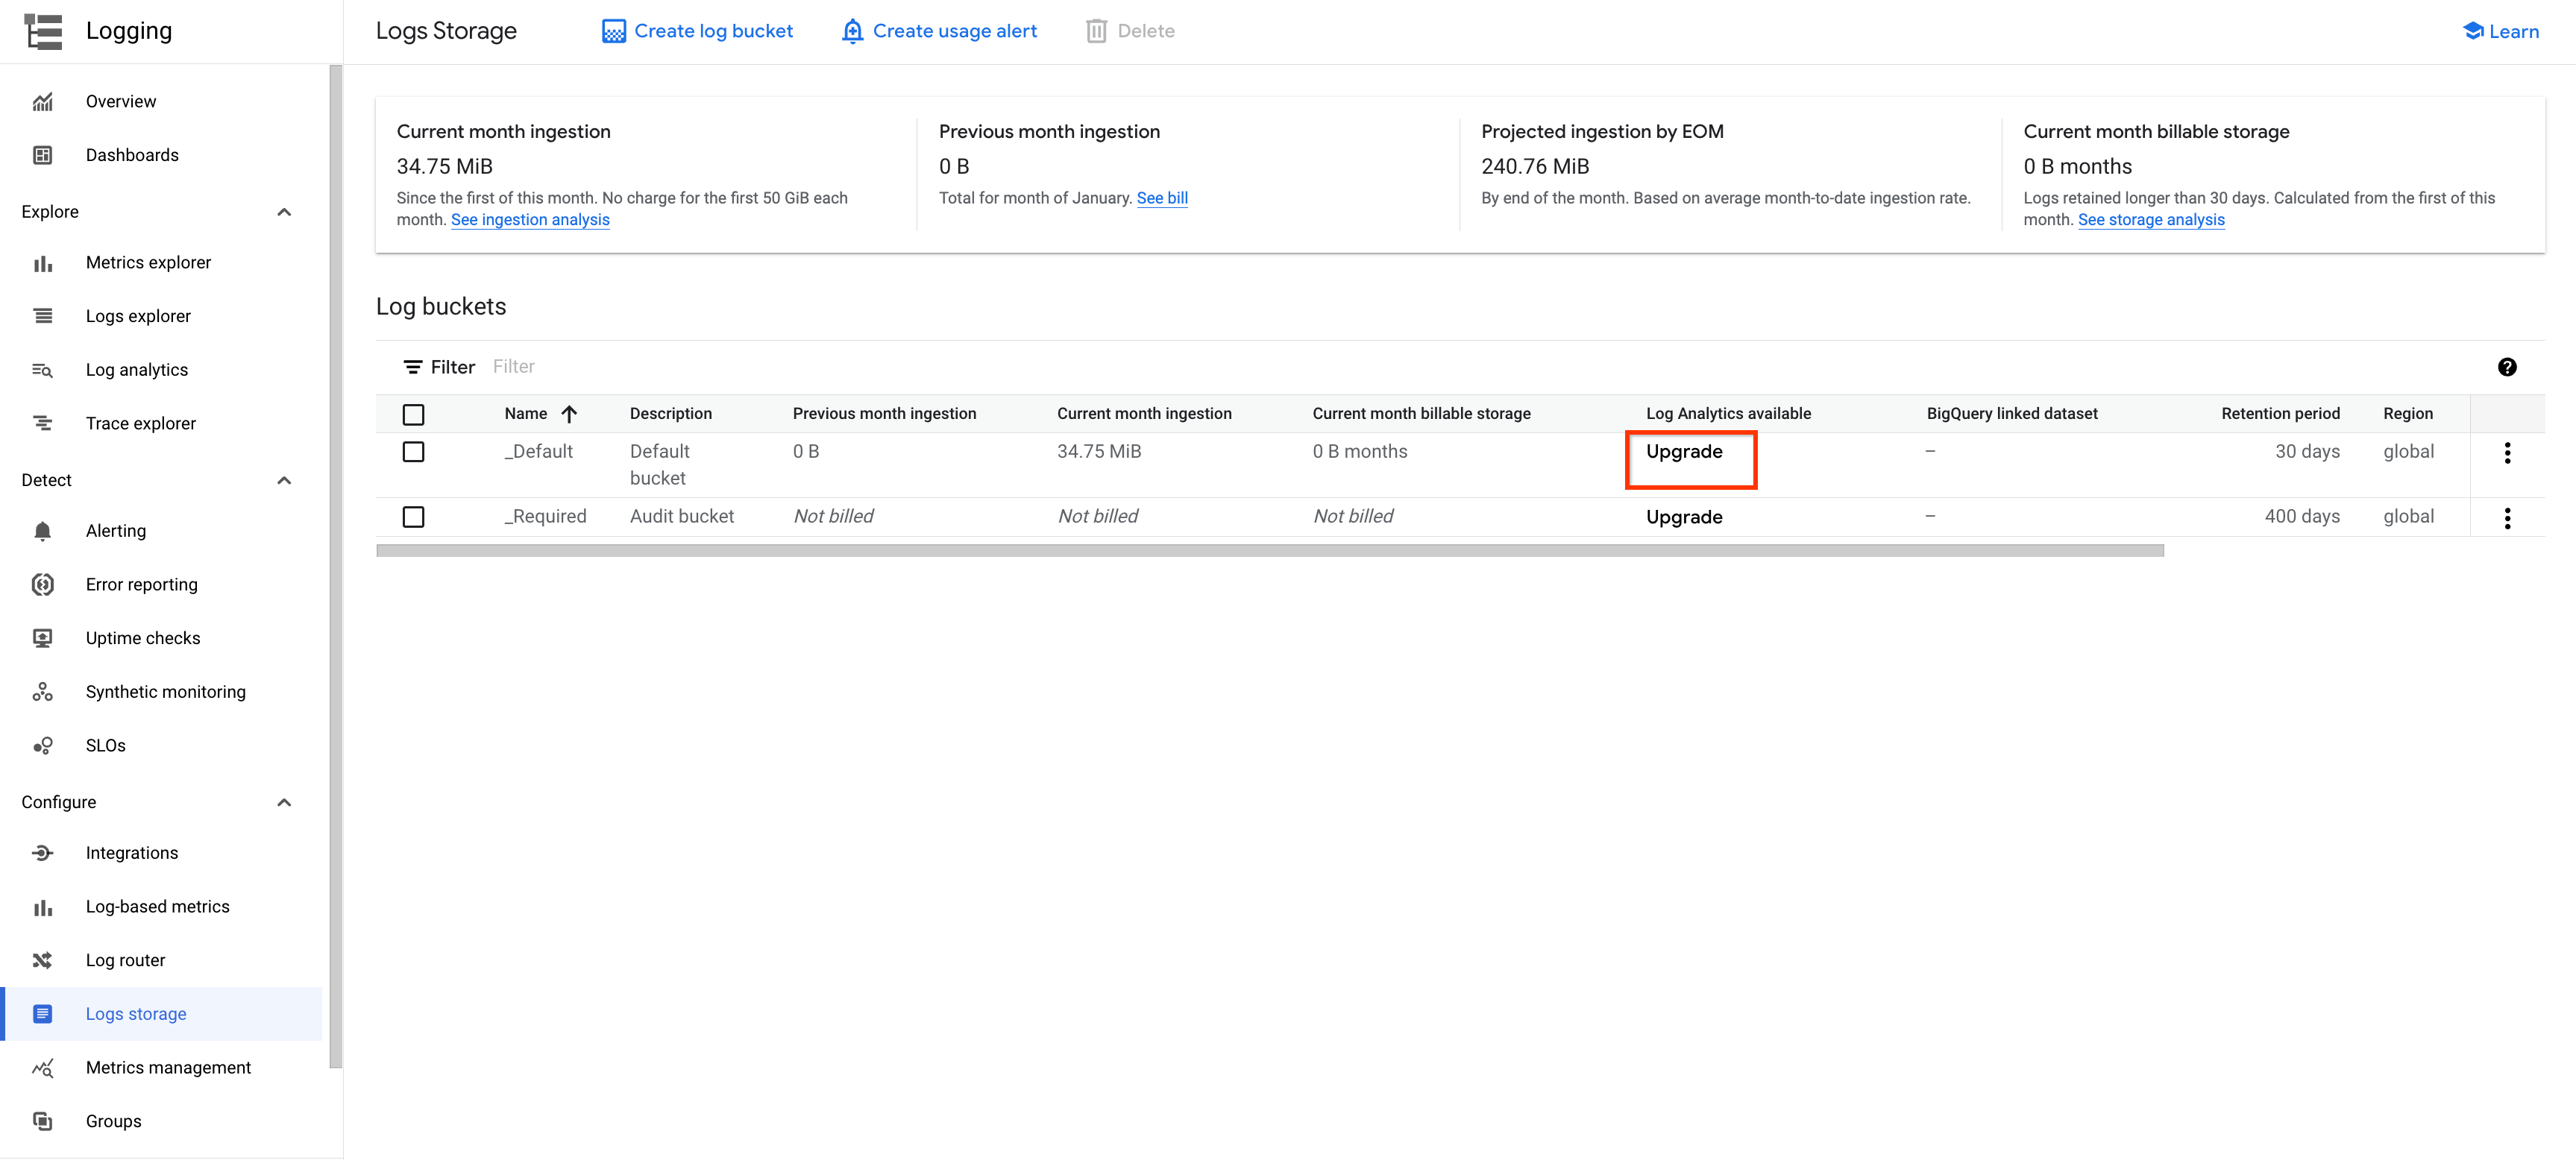
On the Navigation menu, click Logging, then click Logs Storage.
Click UPGRADE for an existing bucket, for example, the
_Defaultbucket.
Click UPGRADE in the popup window.
Wait for the upgrade to complete. Initially the status changes to Not eligible for upgrade before you see the Upgraded status.
Click the OPEN dropdown button.
Select the view
_AllLogs, the Log Analytics page will open for you.
Create a new Log bucket
Alternatively, you can configure Cloud Logging to create a new log bucket with Log Analytics enabled.
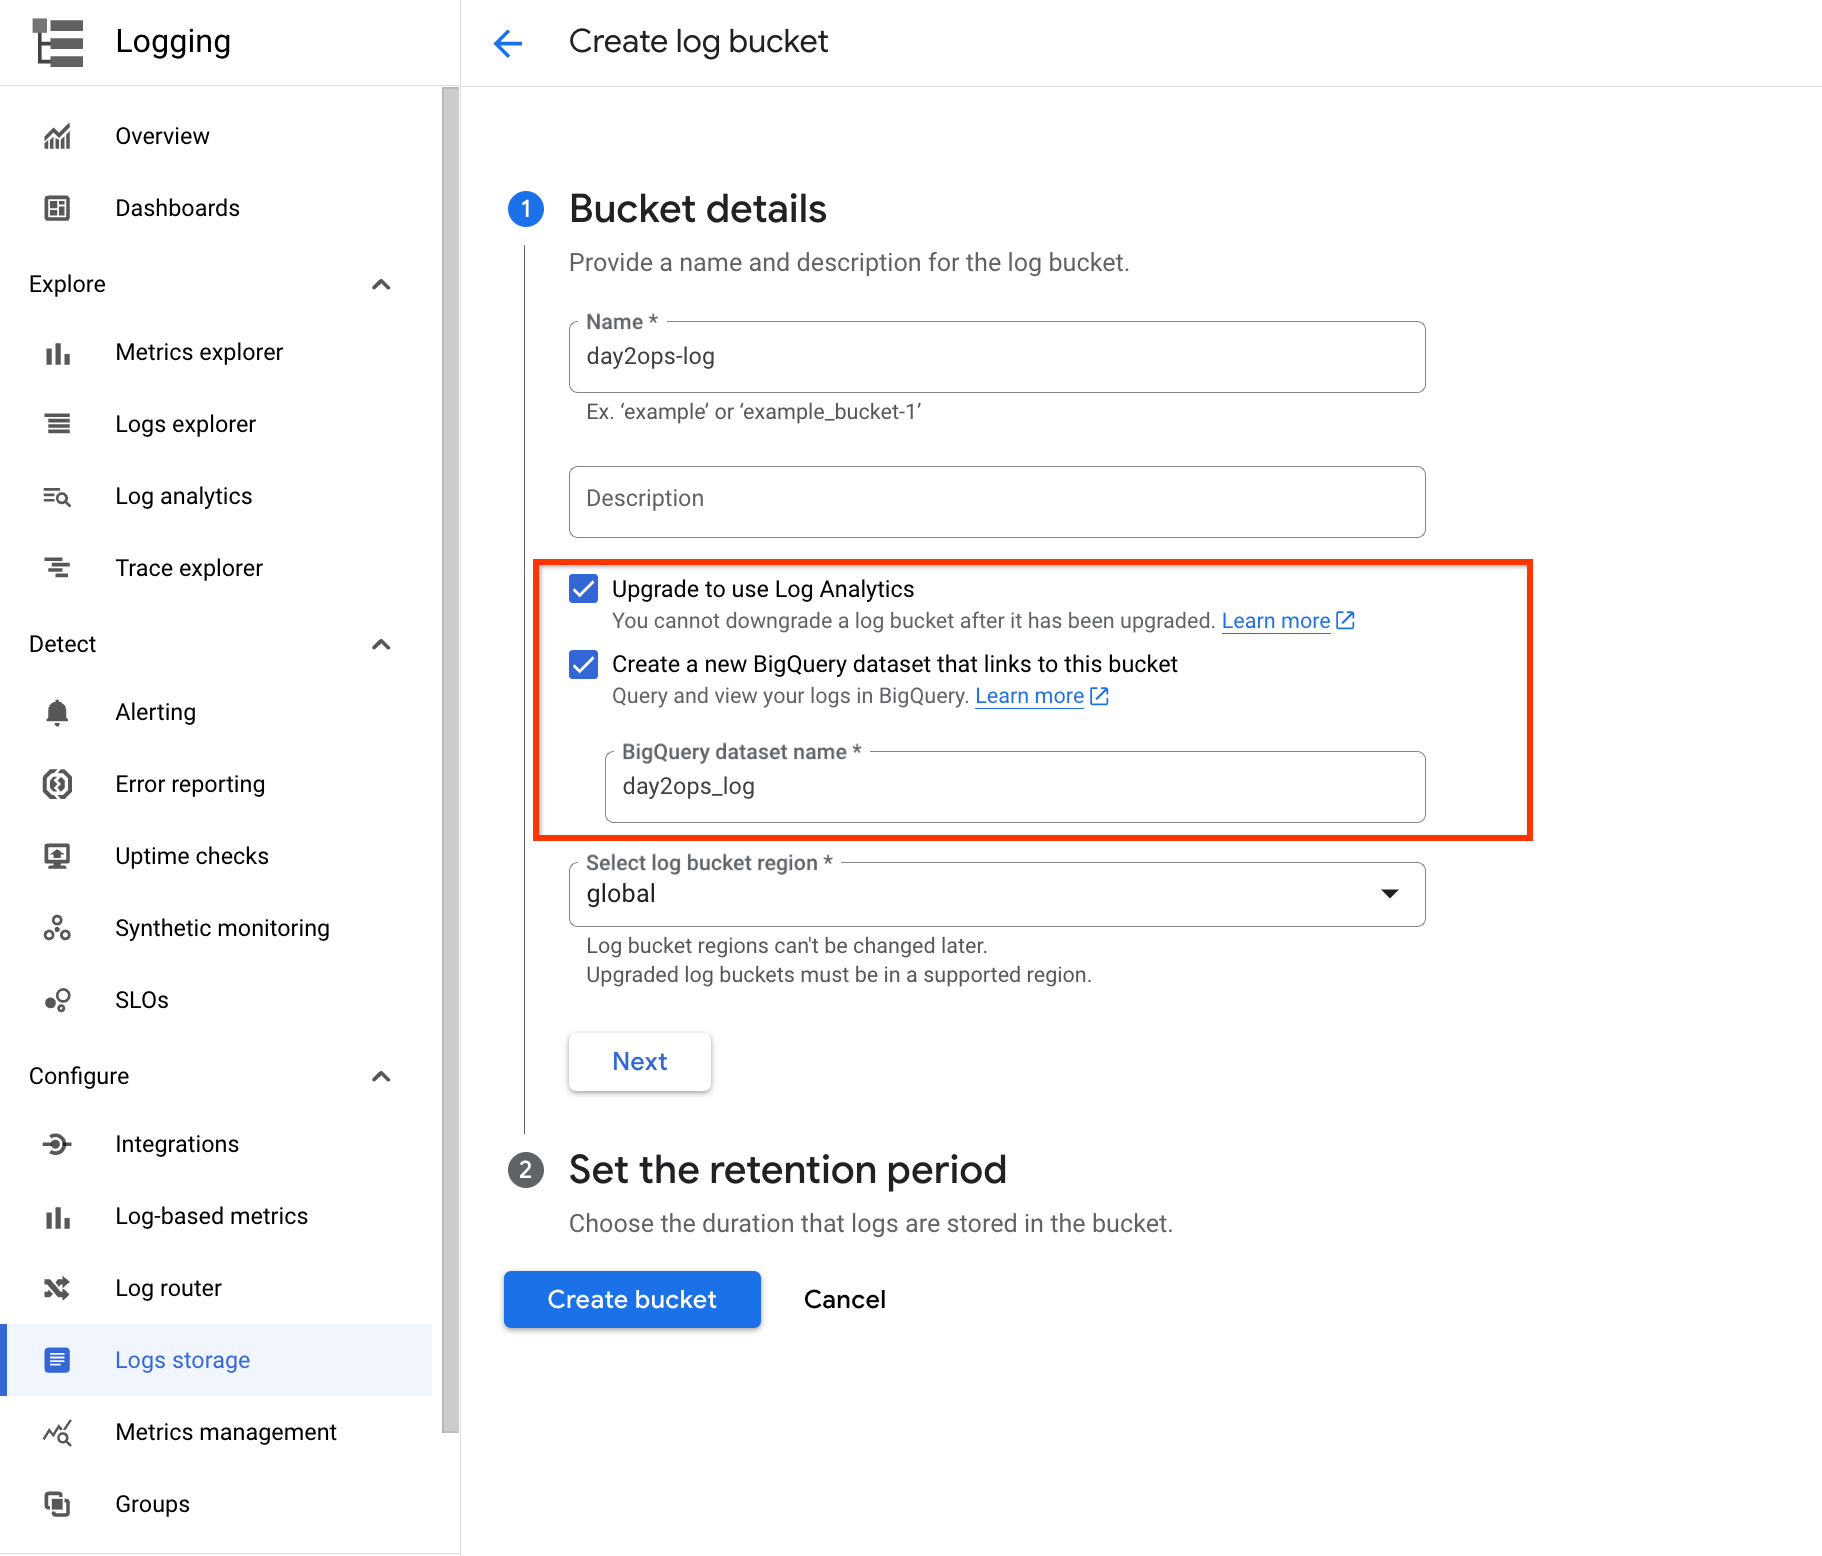
On the left-hand menu open Logging, then click Logs Storage.
Click CREATE LOG BUCKET at top.
Provide a name such as day2ops-log to the bucket.
Check both Upgrade to use Log Analytics and Create a new BigQuery dataset that links to this bucket.
Type in a dataset name such as: day2ops_log
Selecting Create a linked dataset in BigQuery will create a dataset for you in BigQuery if it does not exist. This way you can run queries in BigQuery if you want to.
- Finally, click Create bucket to create the log bucket.
Click Check my progress to verify the objective.
Create a Log bucket
Check my progress
Write to the new Log bucket
You can create a log sink to use the new log bucket. You can do it from the Logs Router directly. Another easy way to do this is from Logs Explorer. You can run log queries to select and filter the logs you are interested in and create a sink. Once nice thing from that approach is the log query will be automatically copied to the sing configuration as the filter.
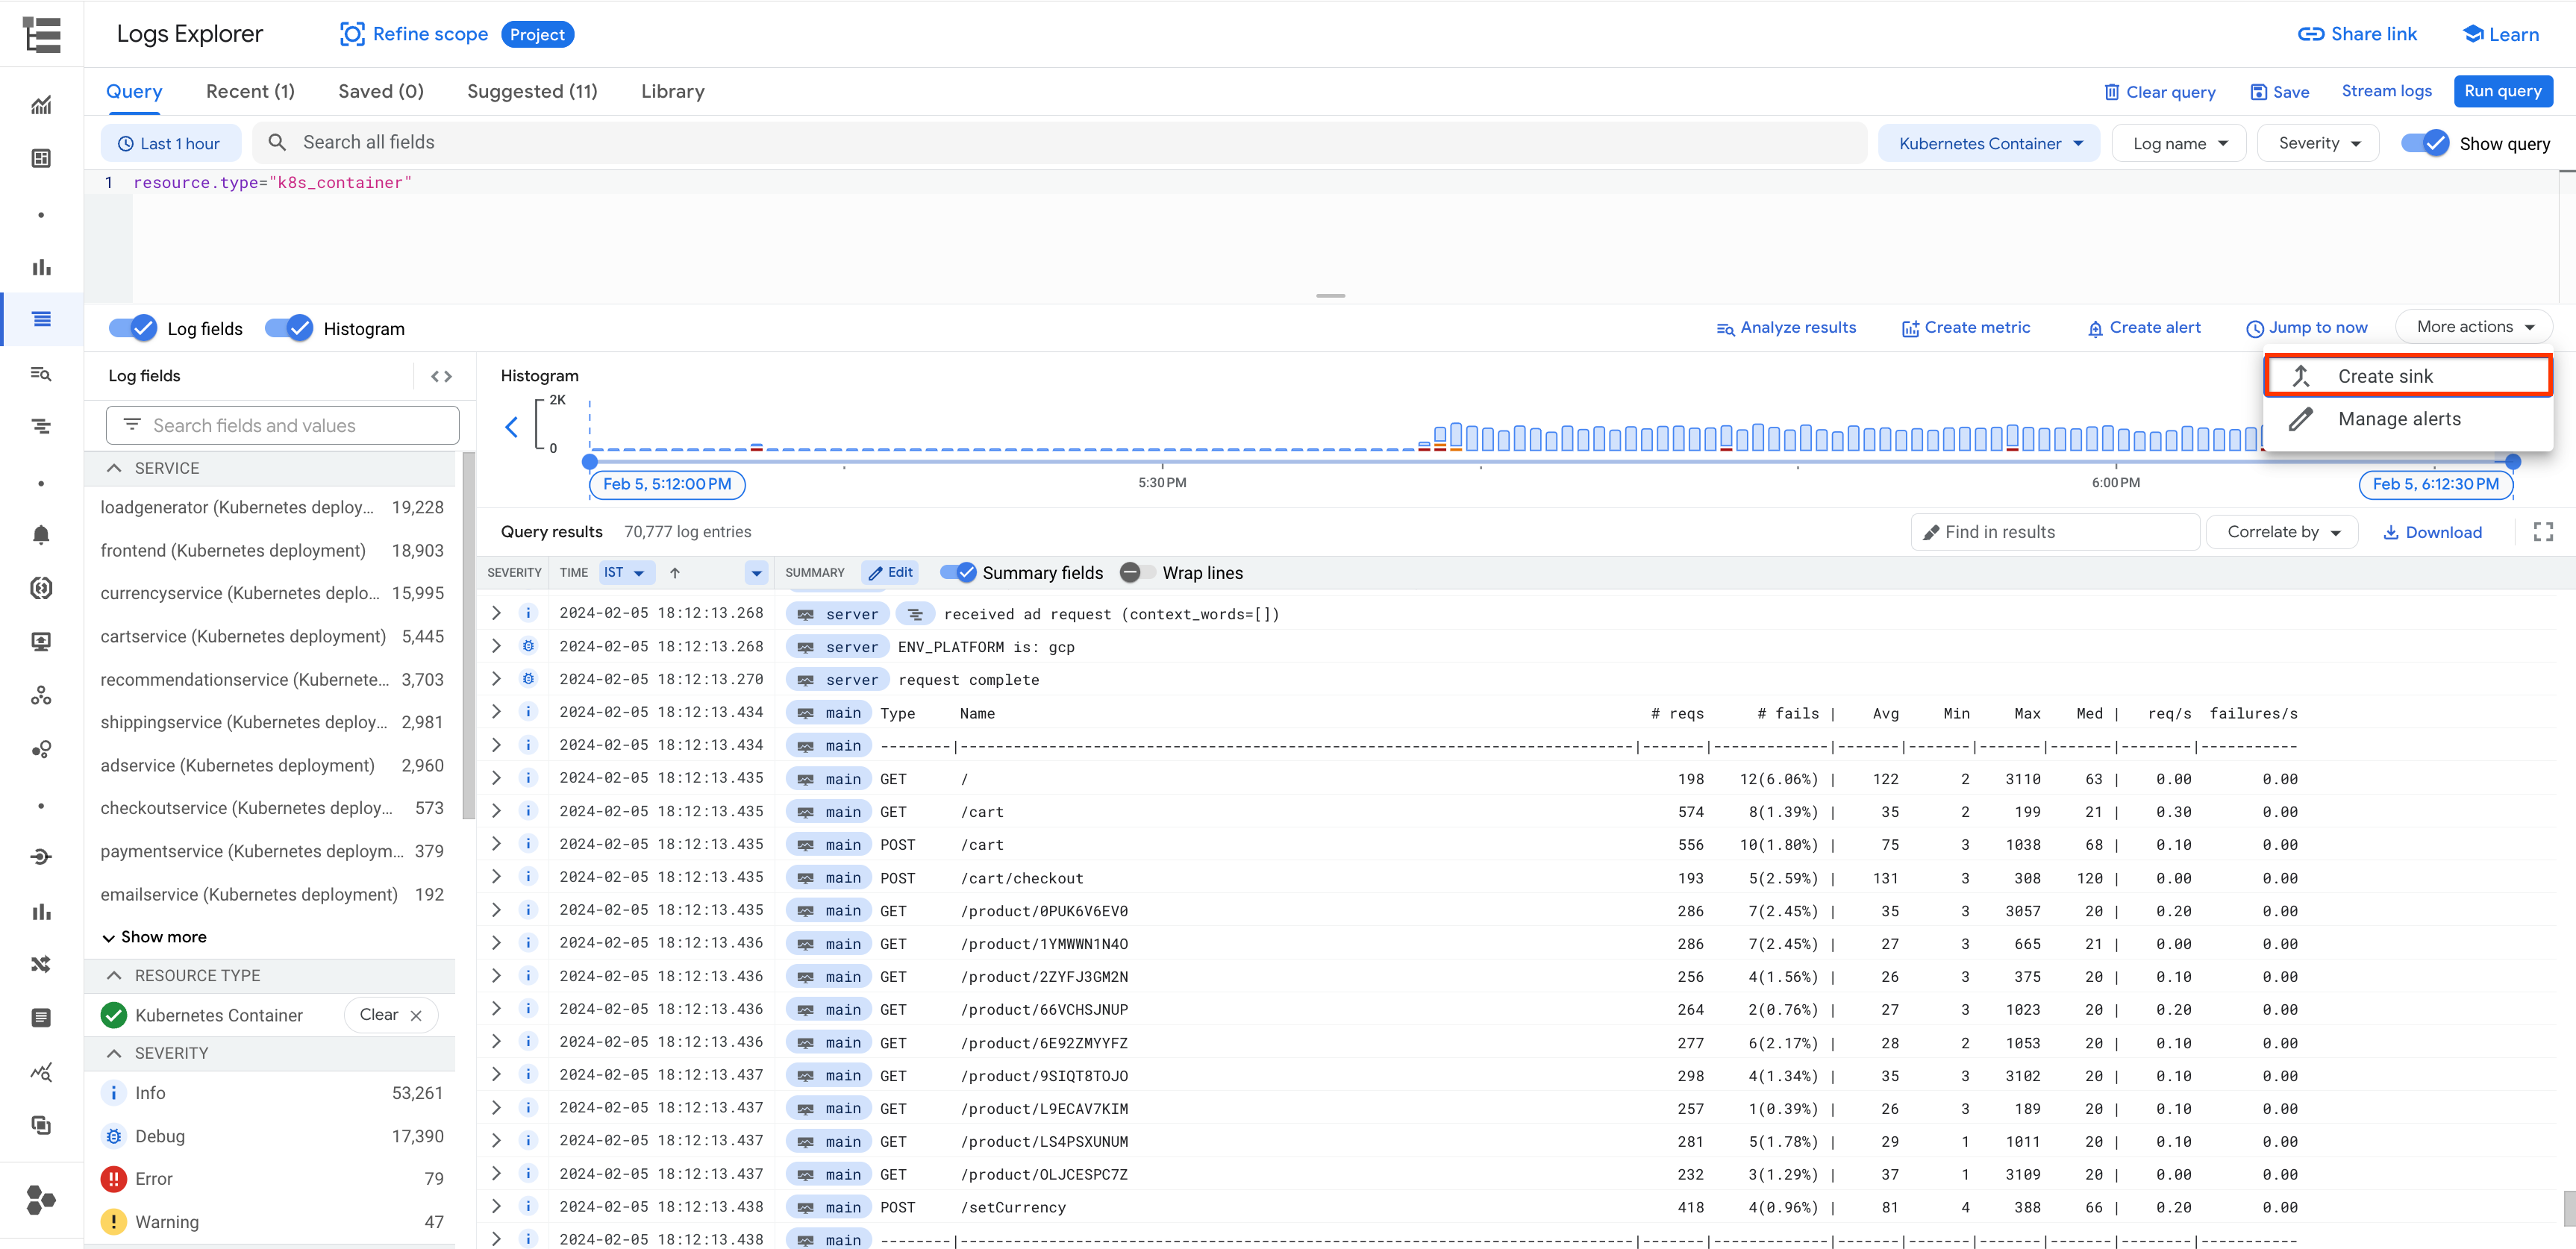
On the Navigation menu, click Logging, then click Logs Explorer.
In the top-right of Logs Explorer, enable Show query and run the following query in the query field:
resource.type="k8s_container"
- Click on More actions then click Create sink.
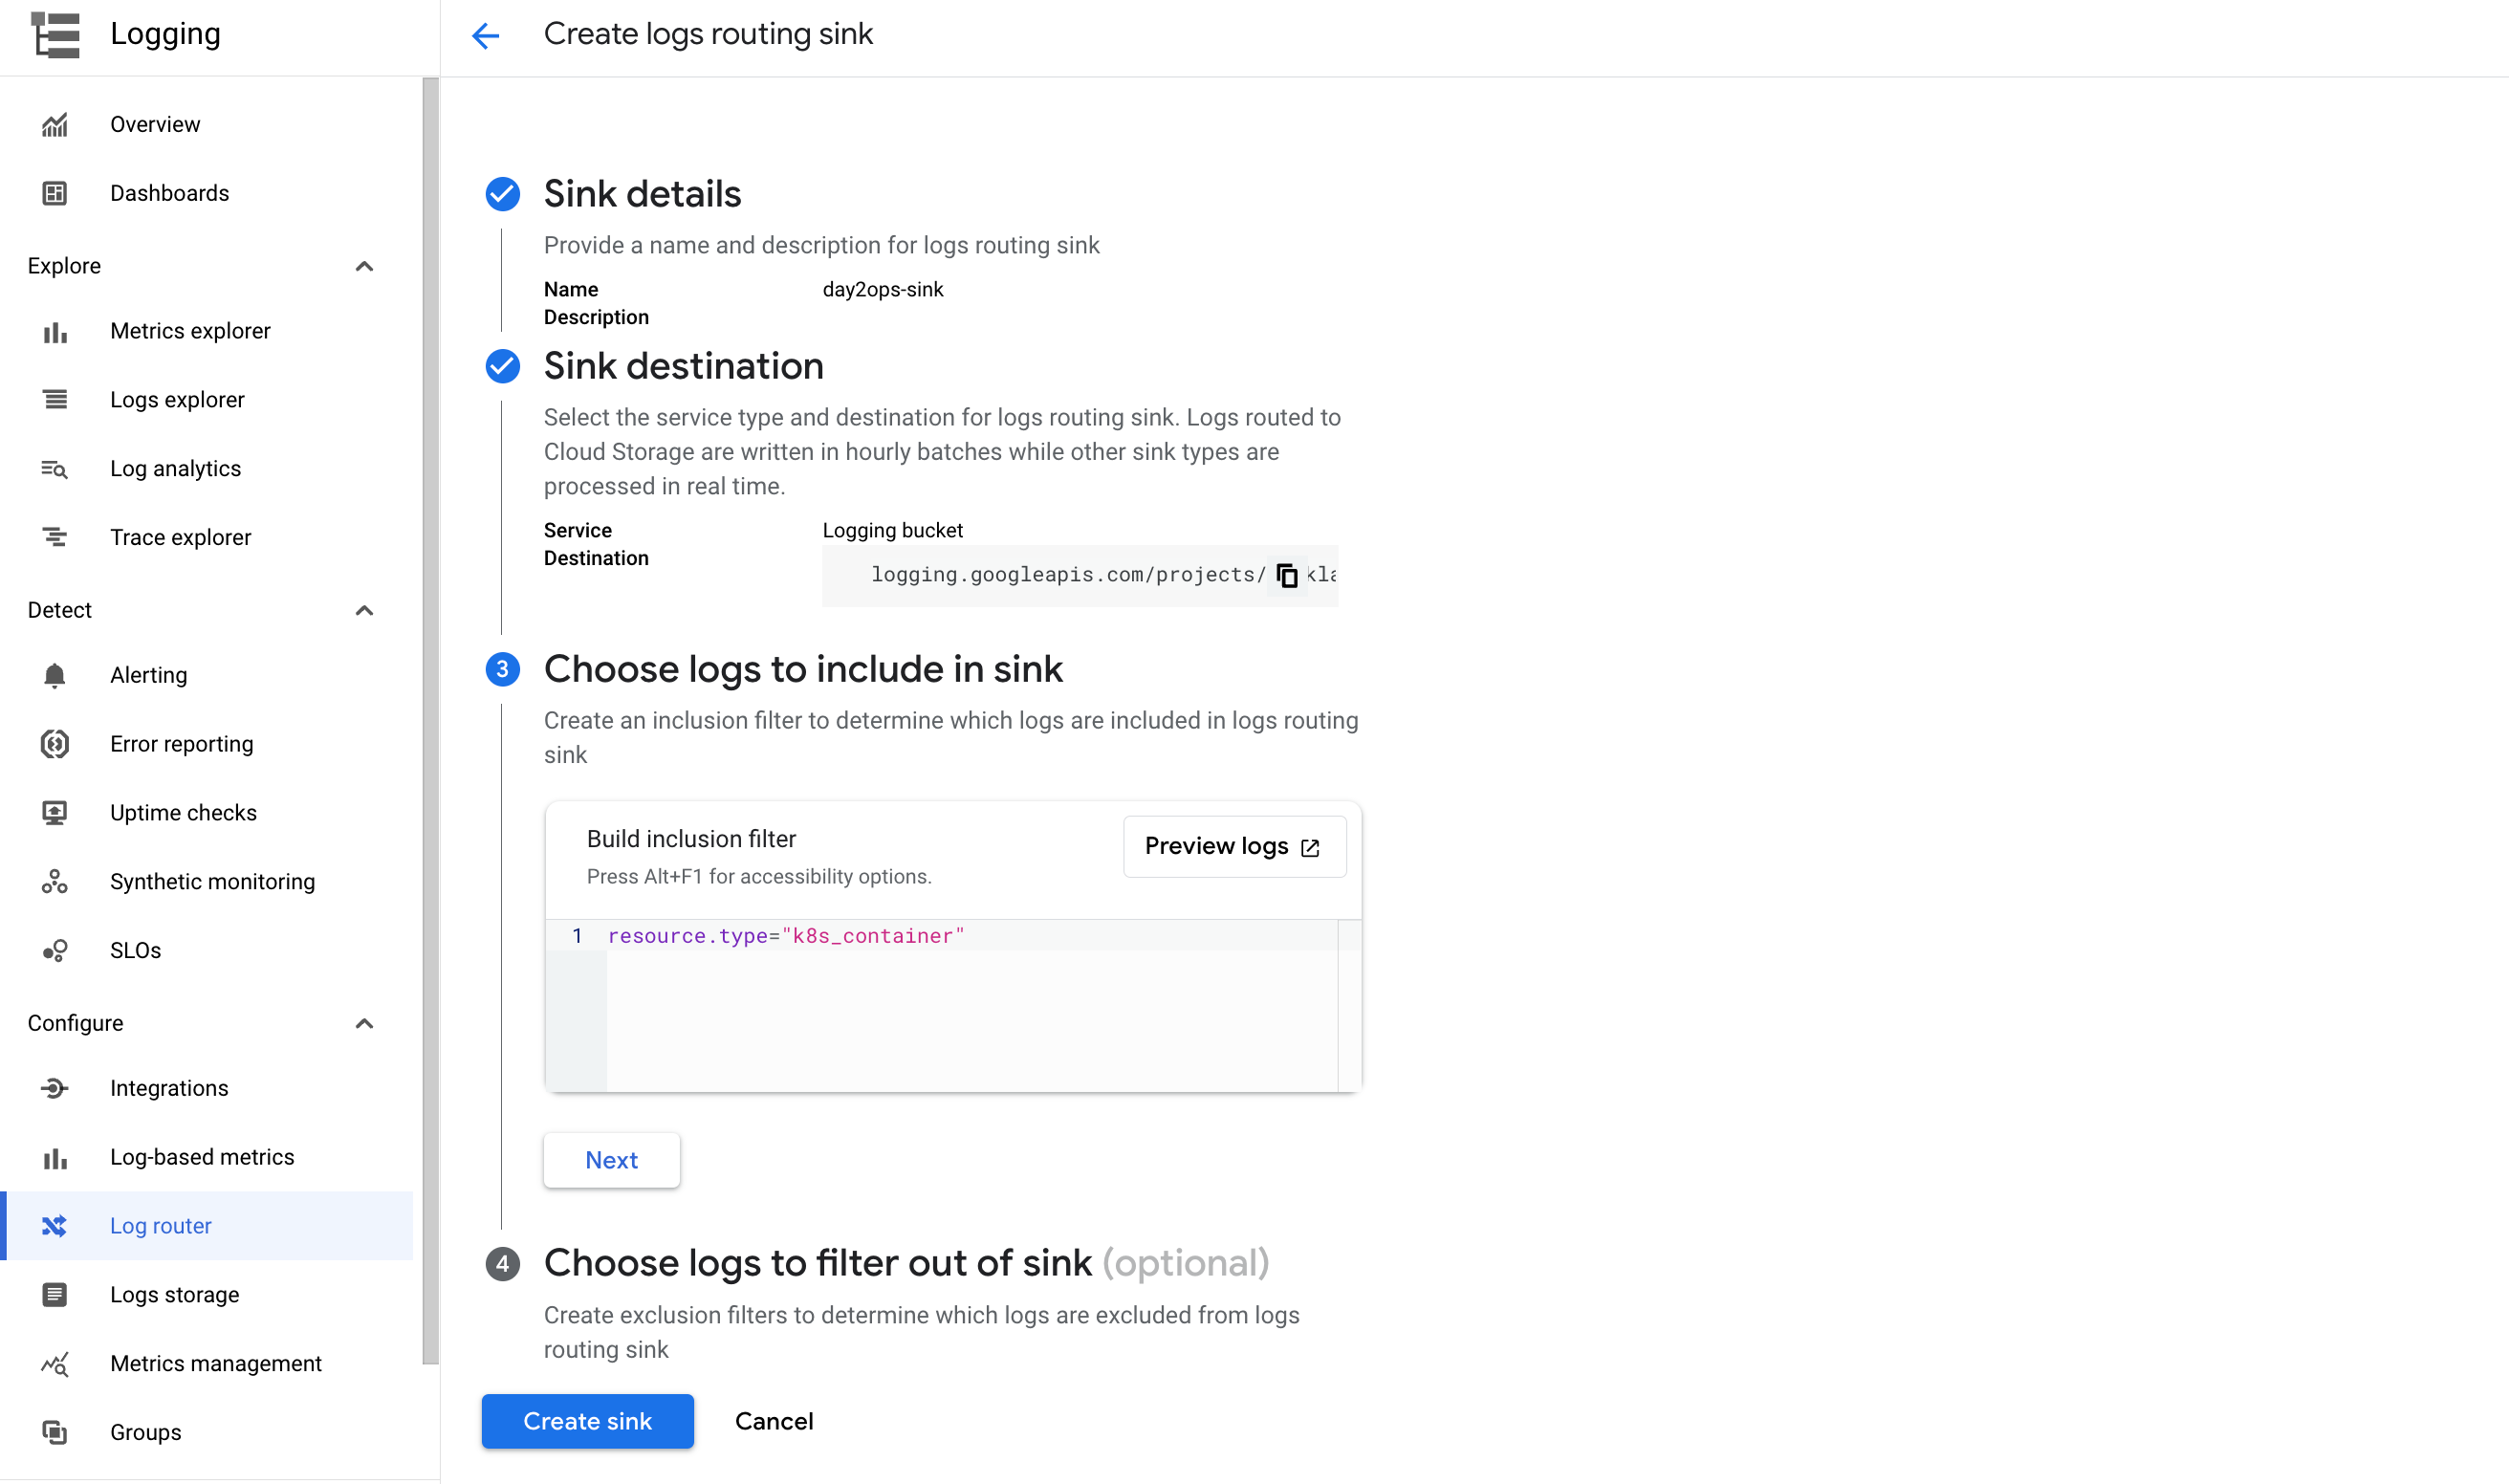
Provide a name such as day2ops-sink as the sink name.
Click NEXT.
Select Logging bucket in the sink service dropdown list.
Select the new log bucket you just created.
Click NEXT.
You should see the resource type query already in the filter.
- Click CREATE SINK.
Wait a little bit and your sink should be created.
Click Check my progress to verify the objective.
create the log sink
Check my progress
Read from the new Log bucket
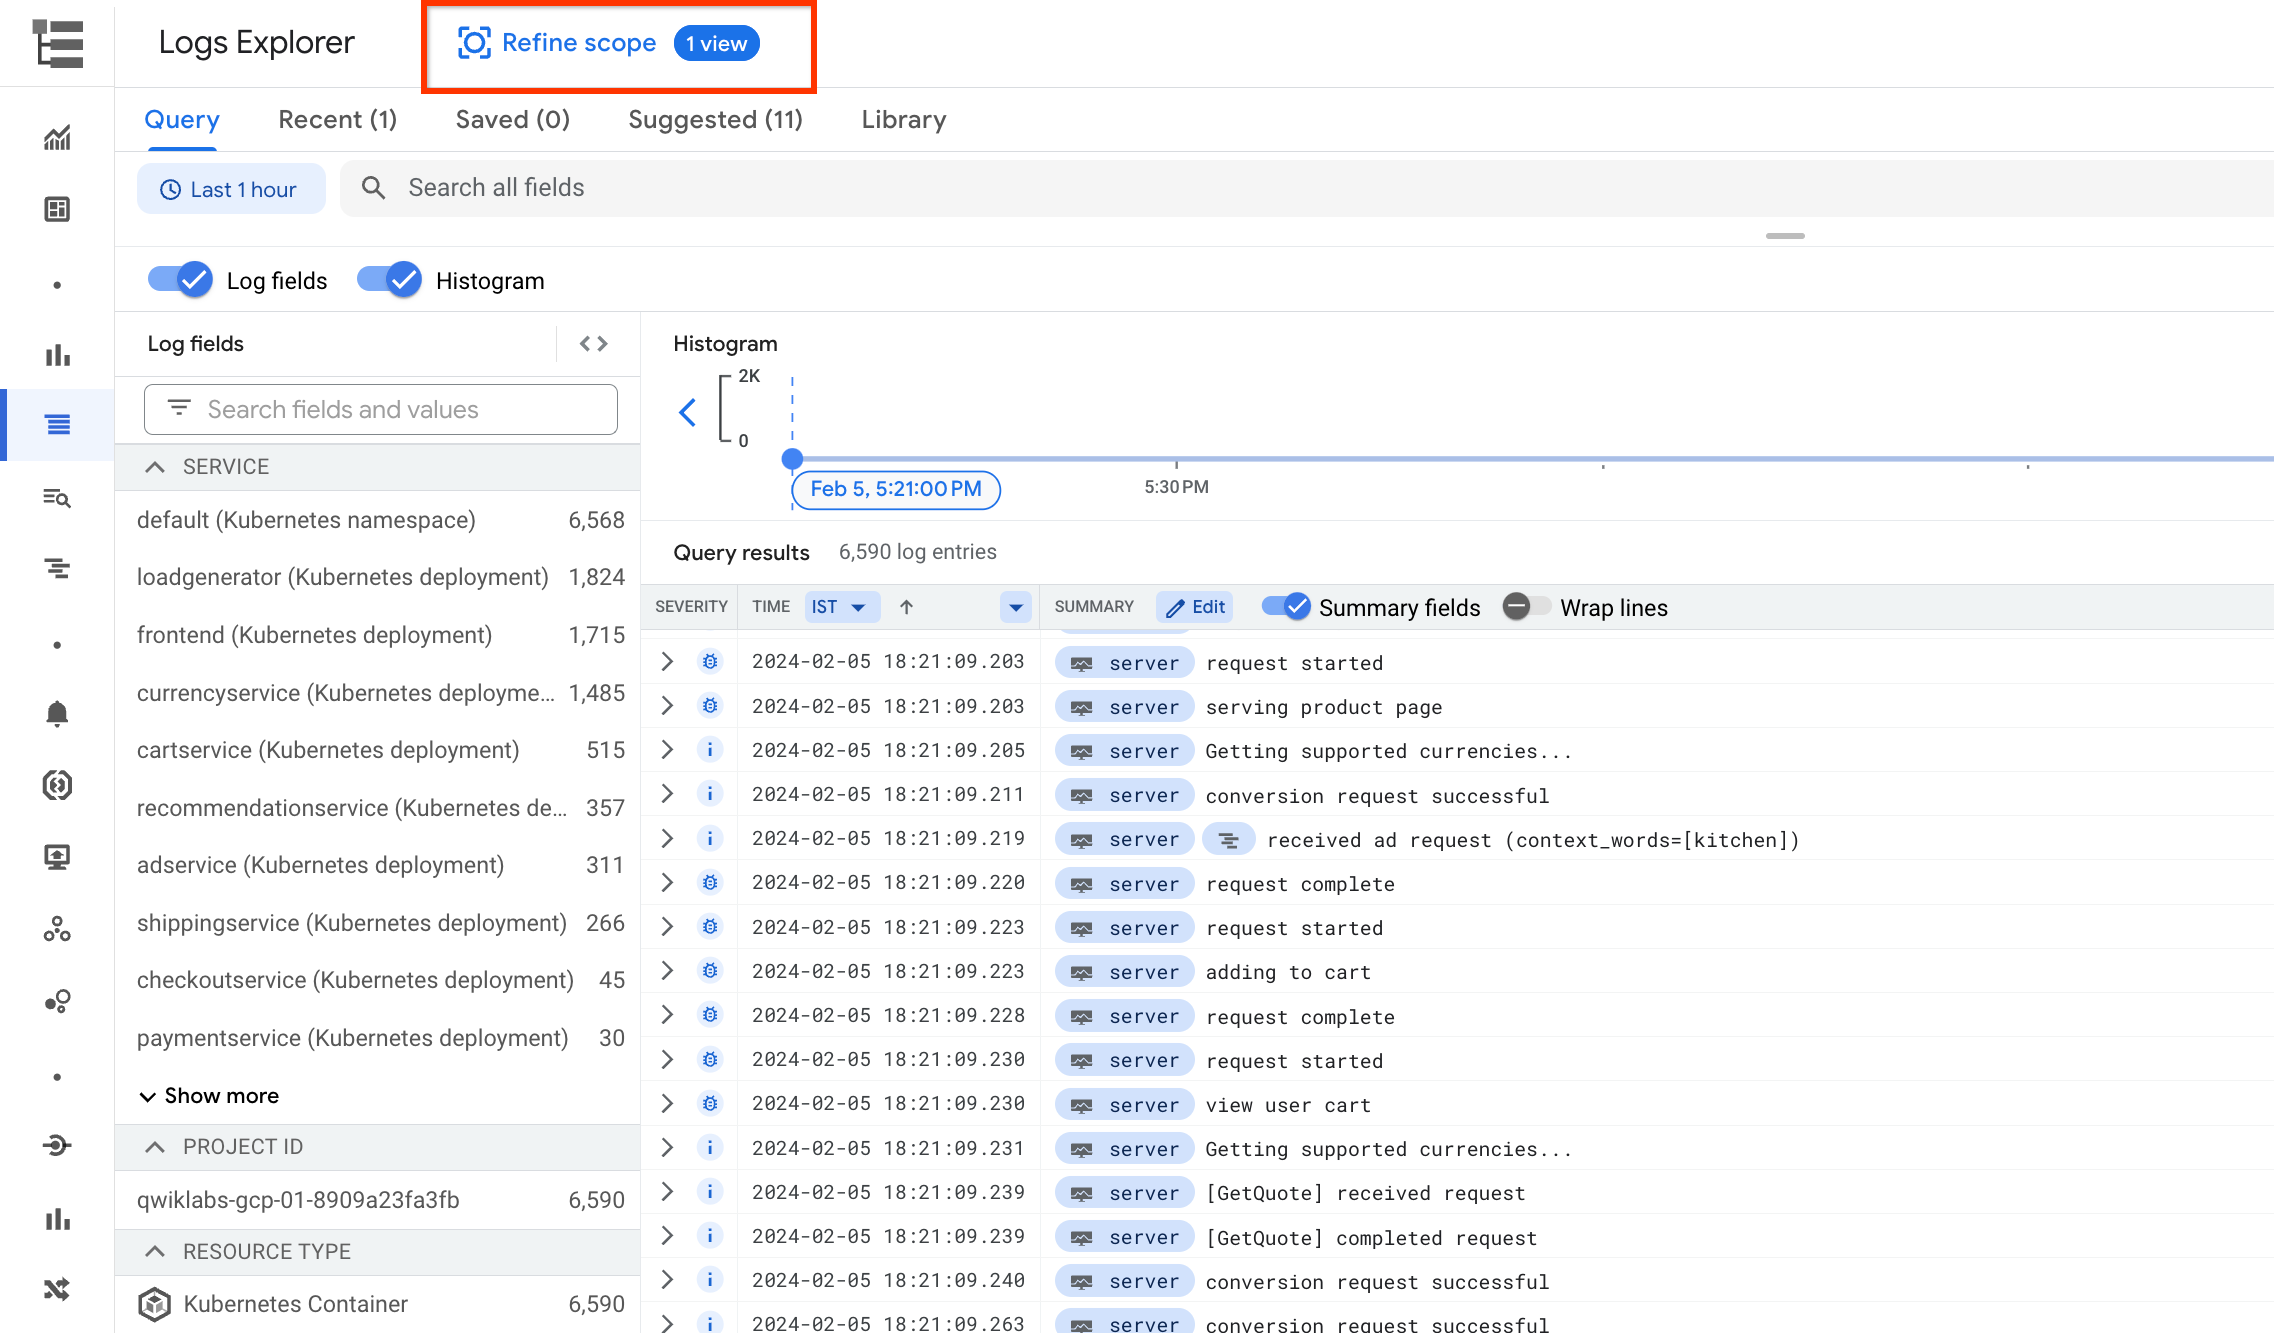
Go back to the Logs Explorer. Notice that there are many different resource types for the logs as highlighted in the screenshot below.
To view the logs in the new log bucket, click REFINE SCOPE at the top of the page.
Select Log view and the new log bucket you just created.
Click APPLY.
You will see Kubernetes Containers is now the only resource type and there are much less log entries now. That's because only filtered logs will be sent to the bucket.
Task 4. Log analysis
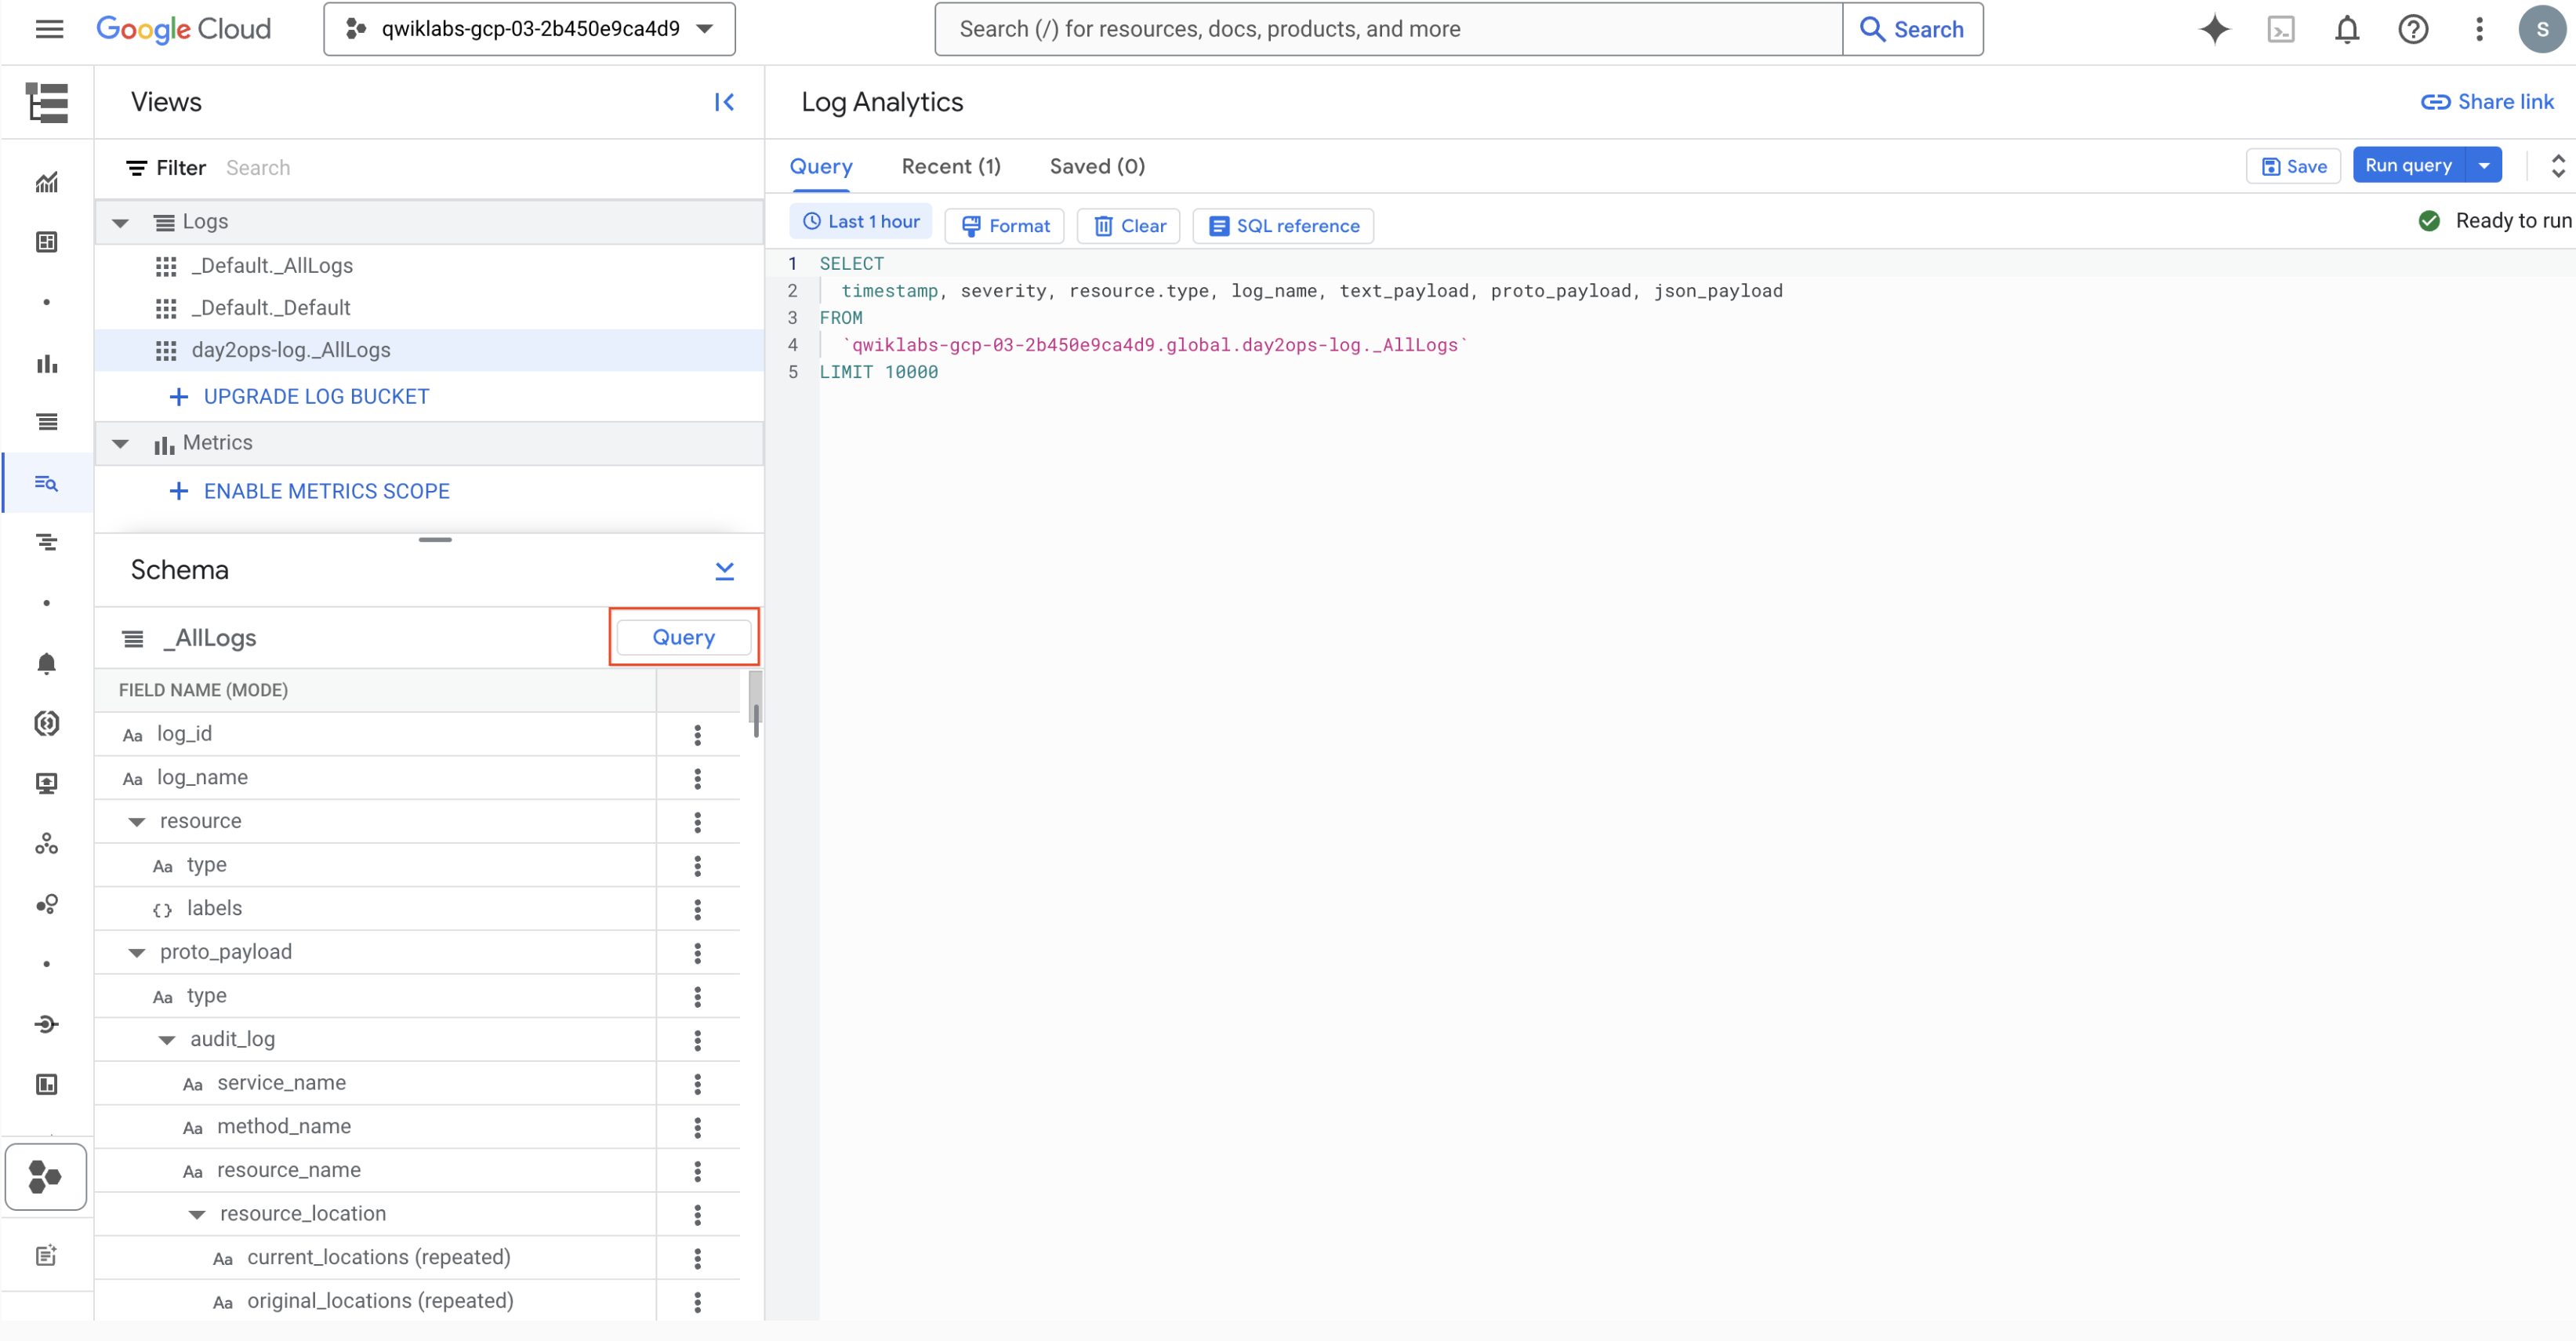
- On the left side, under Logging, click Log Analytics to access the feature. You should see something like the following:
If your query field is empty or you forget which table you want to use, you can click the Query button to get the sample query back.
Now you can run your own queries in the query field. The following are some examples.
Important: The log view name in the FROM clause is different for the log buckets. You need to make sure you use the correct view name. You can use the previous step to verify.
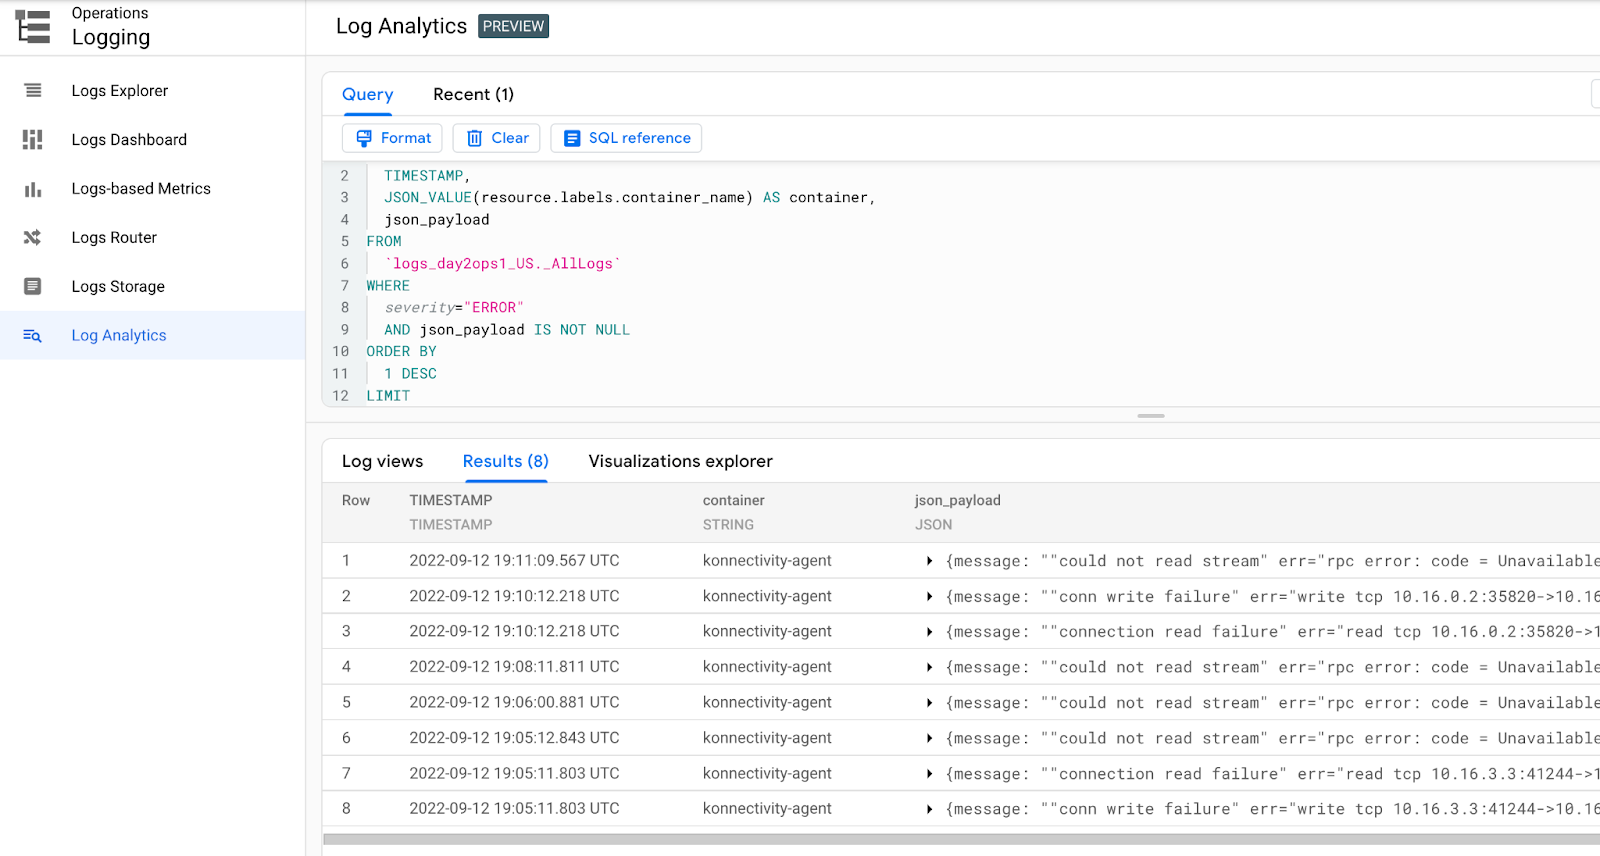
To find the most recent errors:
You want to find the most recent errors for from the containers:
SELECT
 TIMESTAMP,
 JSON_VALUE(resource.labels.container_name) AS container,
 json_payload
FROM
 `qwiklabs-gcp-03-57b96a44bfe3.global.day2ops-log._AllLogs`
WHERE
 severity="ERROR"
 AND json_payload IS NOT NULL
ORDER BY
 1 DESC
LIMIT
 50
After run the query, you should see the output like the following:
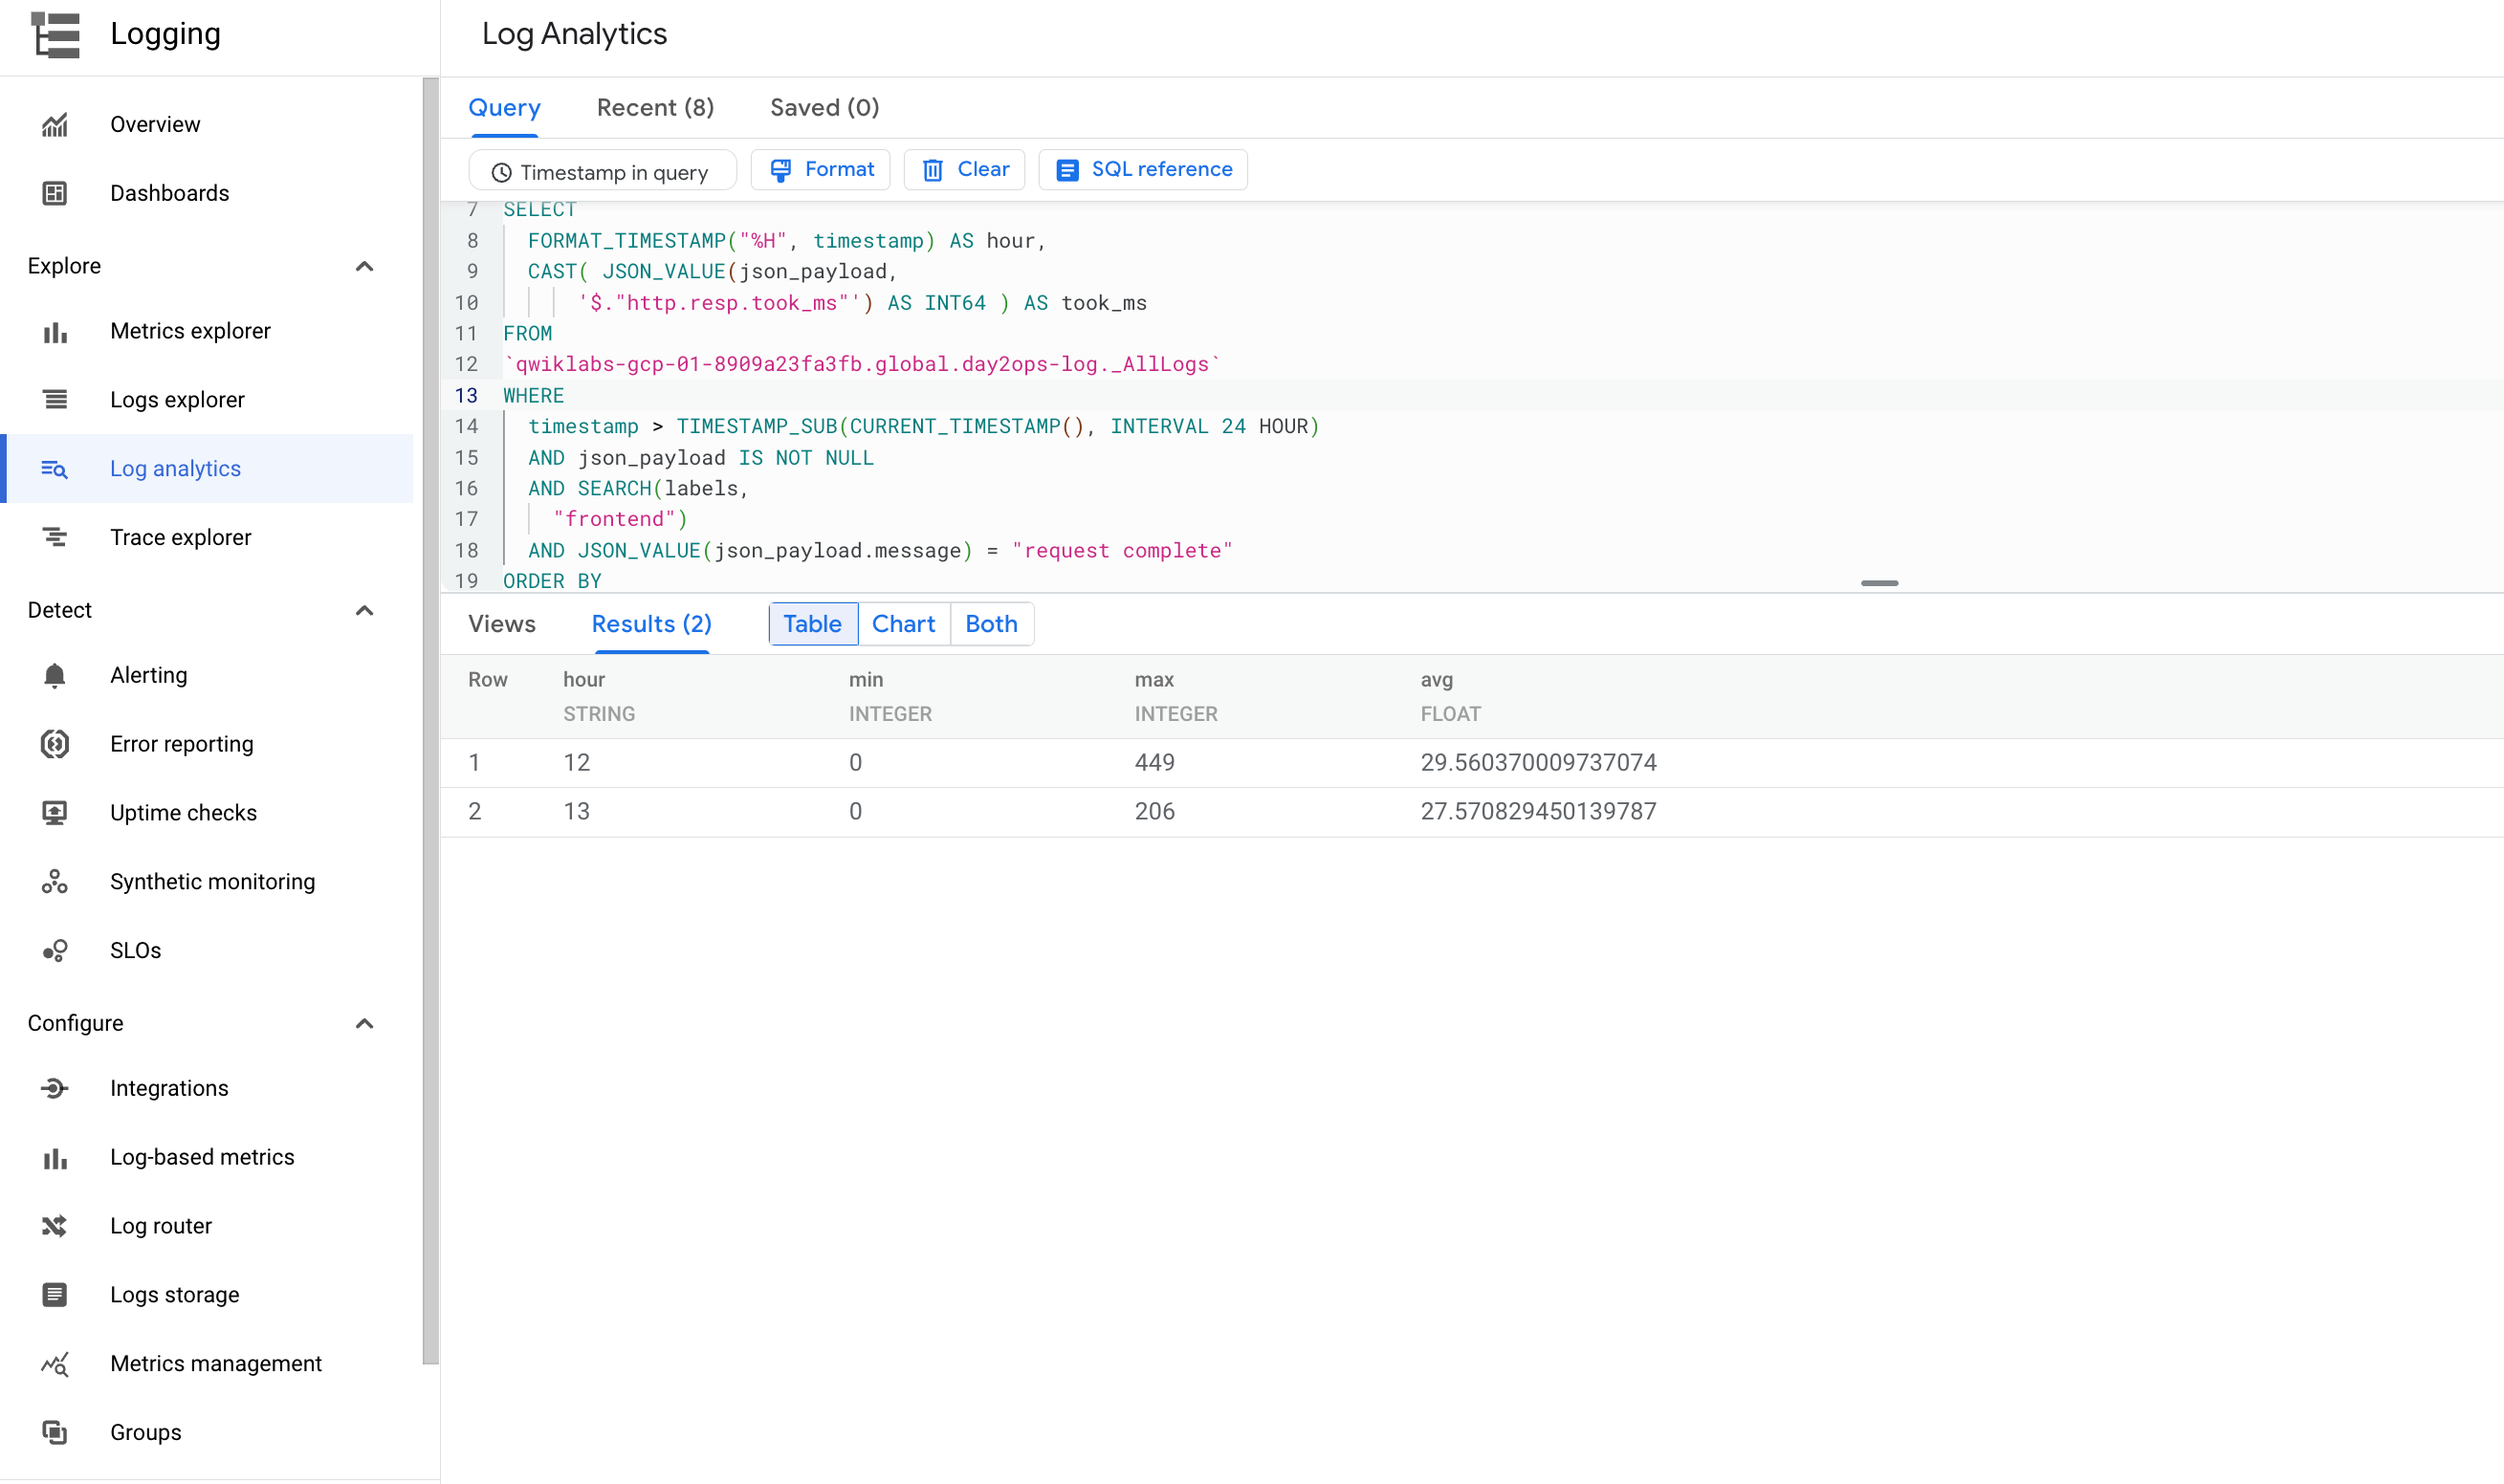
To find the min, max, and average latency:
You can view the min, max, and average latencies in a timeframe for the frontend service:
SELECT
hour,
MIN(took_ms) AS min,
MAX(took_ms) AS max,
AVG(took_ms) AS avg
FROM (
SELECT
  FORMAT_TIMESTAMP("%H", timestamp) AS hour,
  CAST( JSON_VALUE(json_payload,
      '$."http.resp.took_ms"') AS INT64 ) AS took_ms
FROM
  `qwiklabs-gcp-03-57b96a44bfe3.global.day2ops-log._AllLogs`
WHERE
  timestamp > TIMESTAMP_SUB(CURRENT_TIMESTAMP(), INTERVAL 24 HOUR)
  AND json_payload IS NOT NULL
  AND SEARCH(labels,
    "frontend")
  AND JSON_VALUE(json_payload.message) = "request complete"
ORDER BY
  took_ms DESC,
  timestamp ASC )
GROUP BY
1
ORDER BY
1
After run the query, you should see the output like the following:
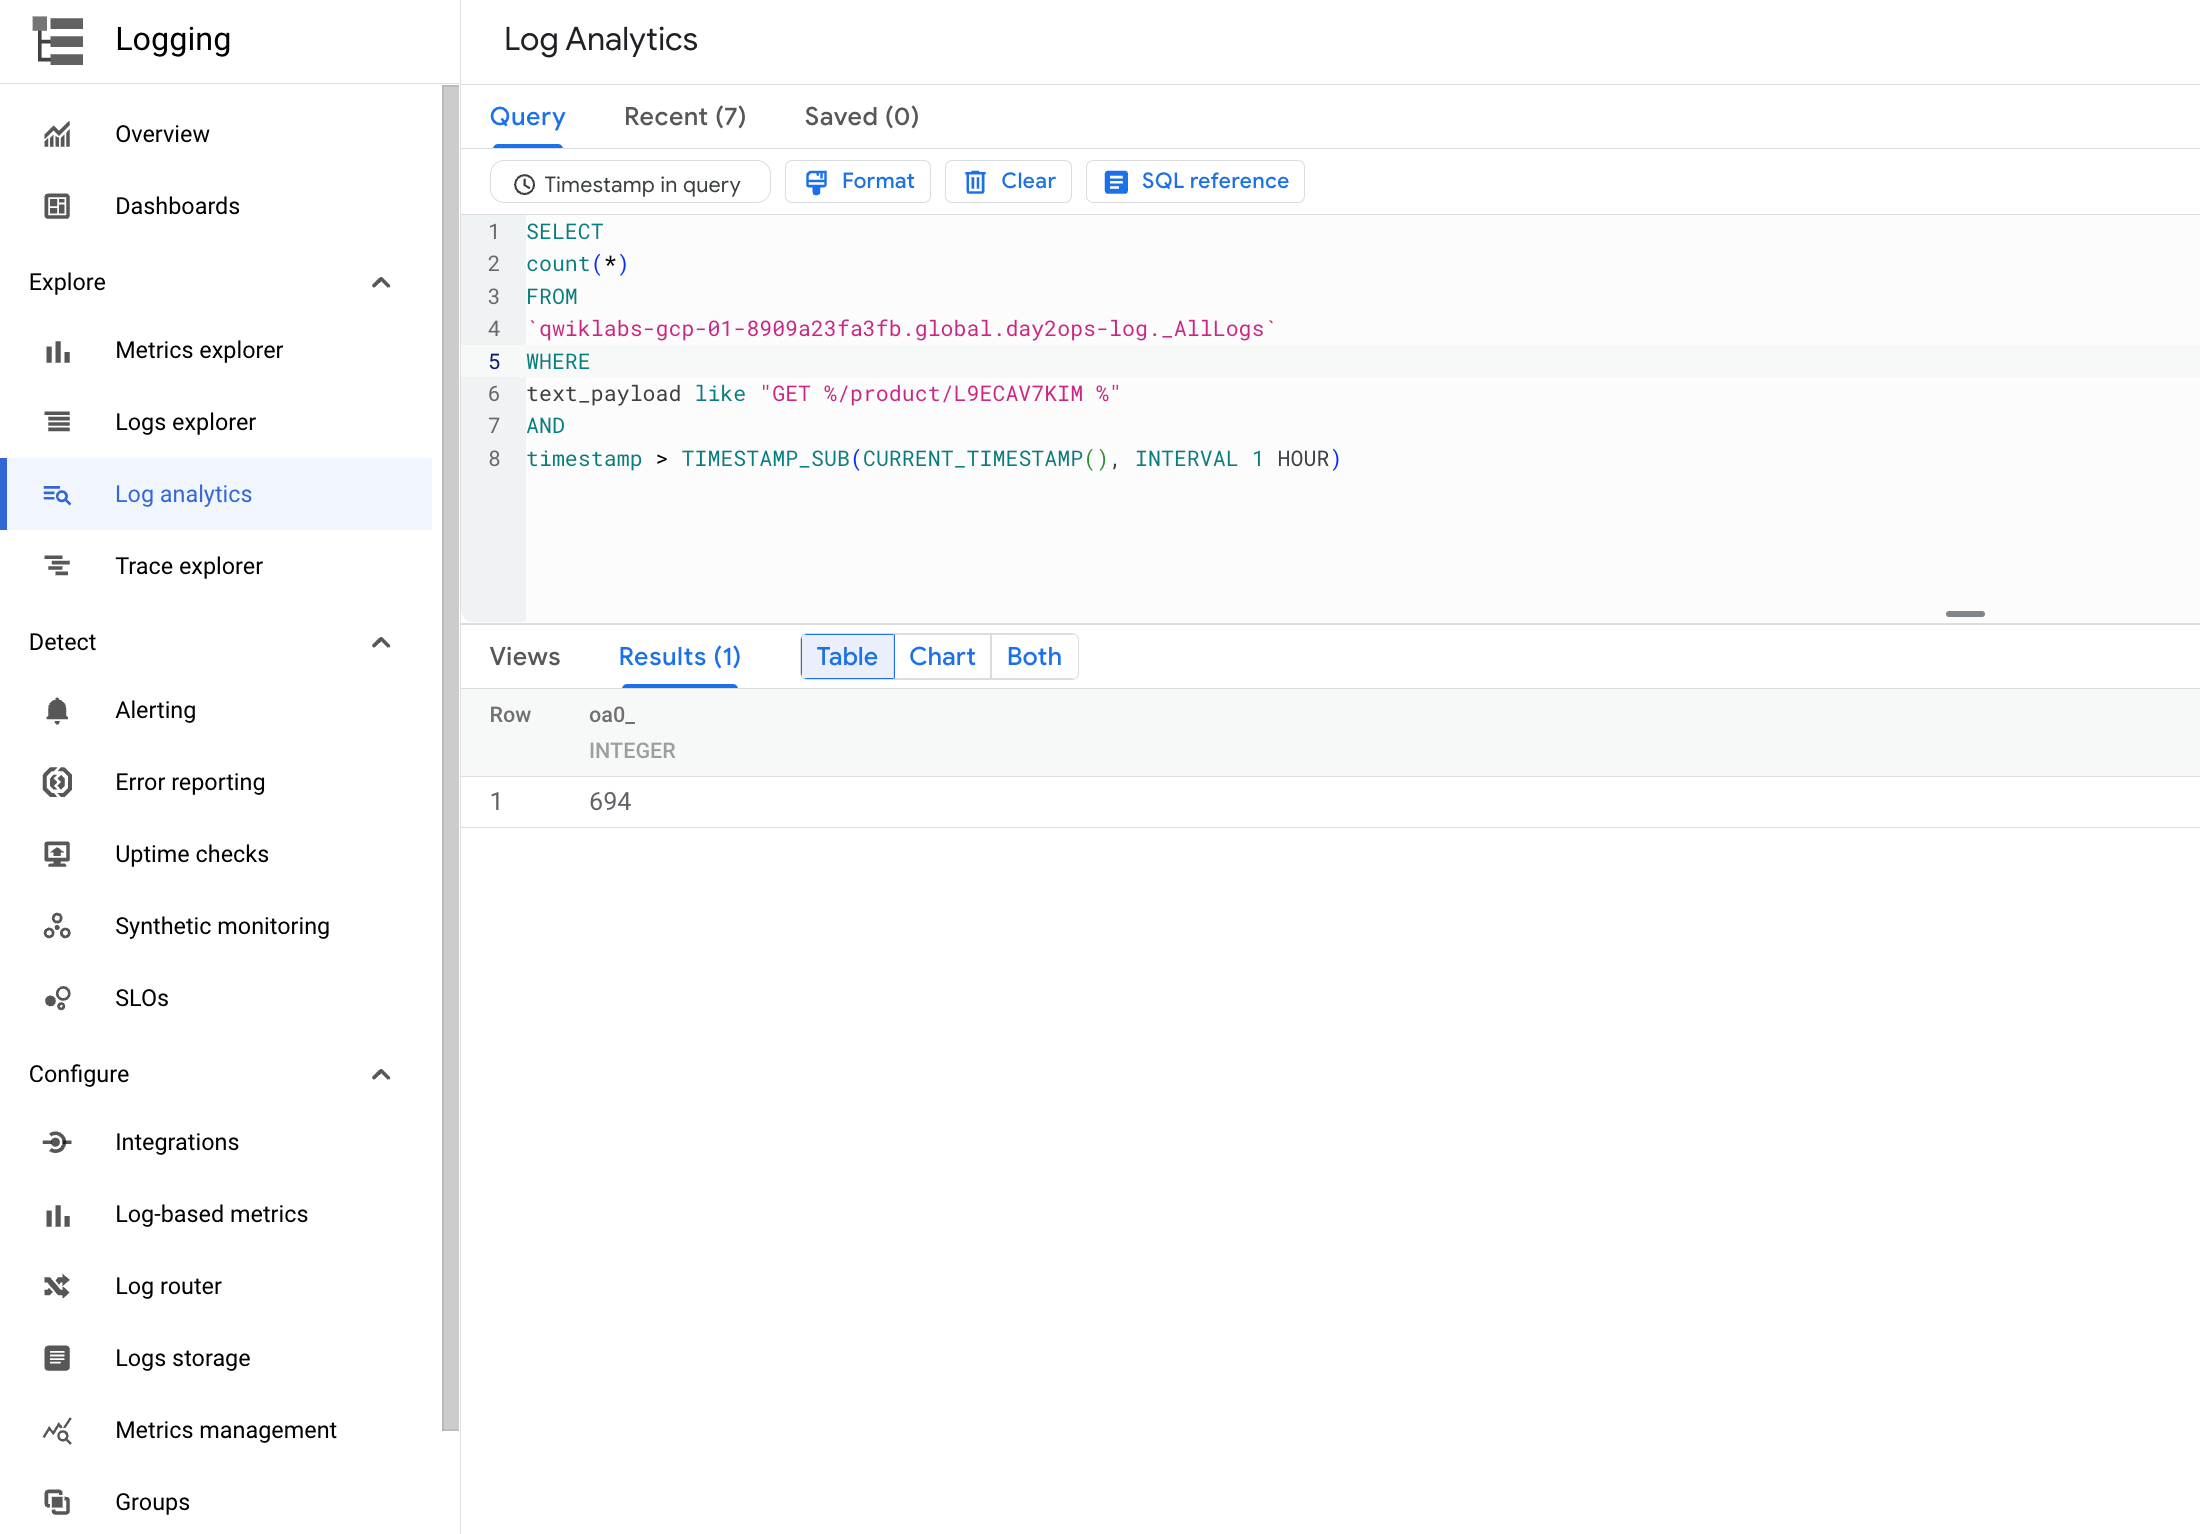
Product page visit number
You want to know how many times users visit a certain product page in the past hour:
SELECT
count(*)
FROM
`qwiklabs-gcp-03-57b96a44bfe3.global.day2ops-log._AllLogs`
WHERE
text_payload like "GET %/product/L9ECAV7KIM %"
AND
timestamp > TIMESTAMP_SUB(CURRENT_TIMESTAMP(), INTERVAL 1 HOUR)
After run the query, you should see the output like the following:
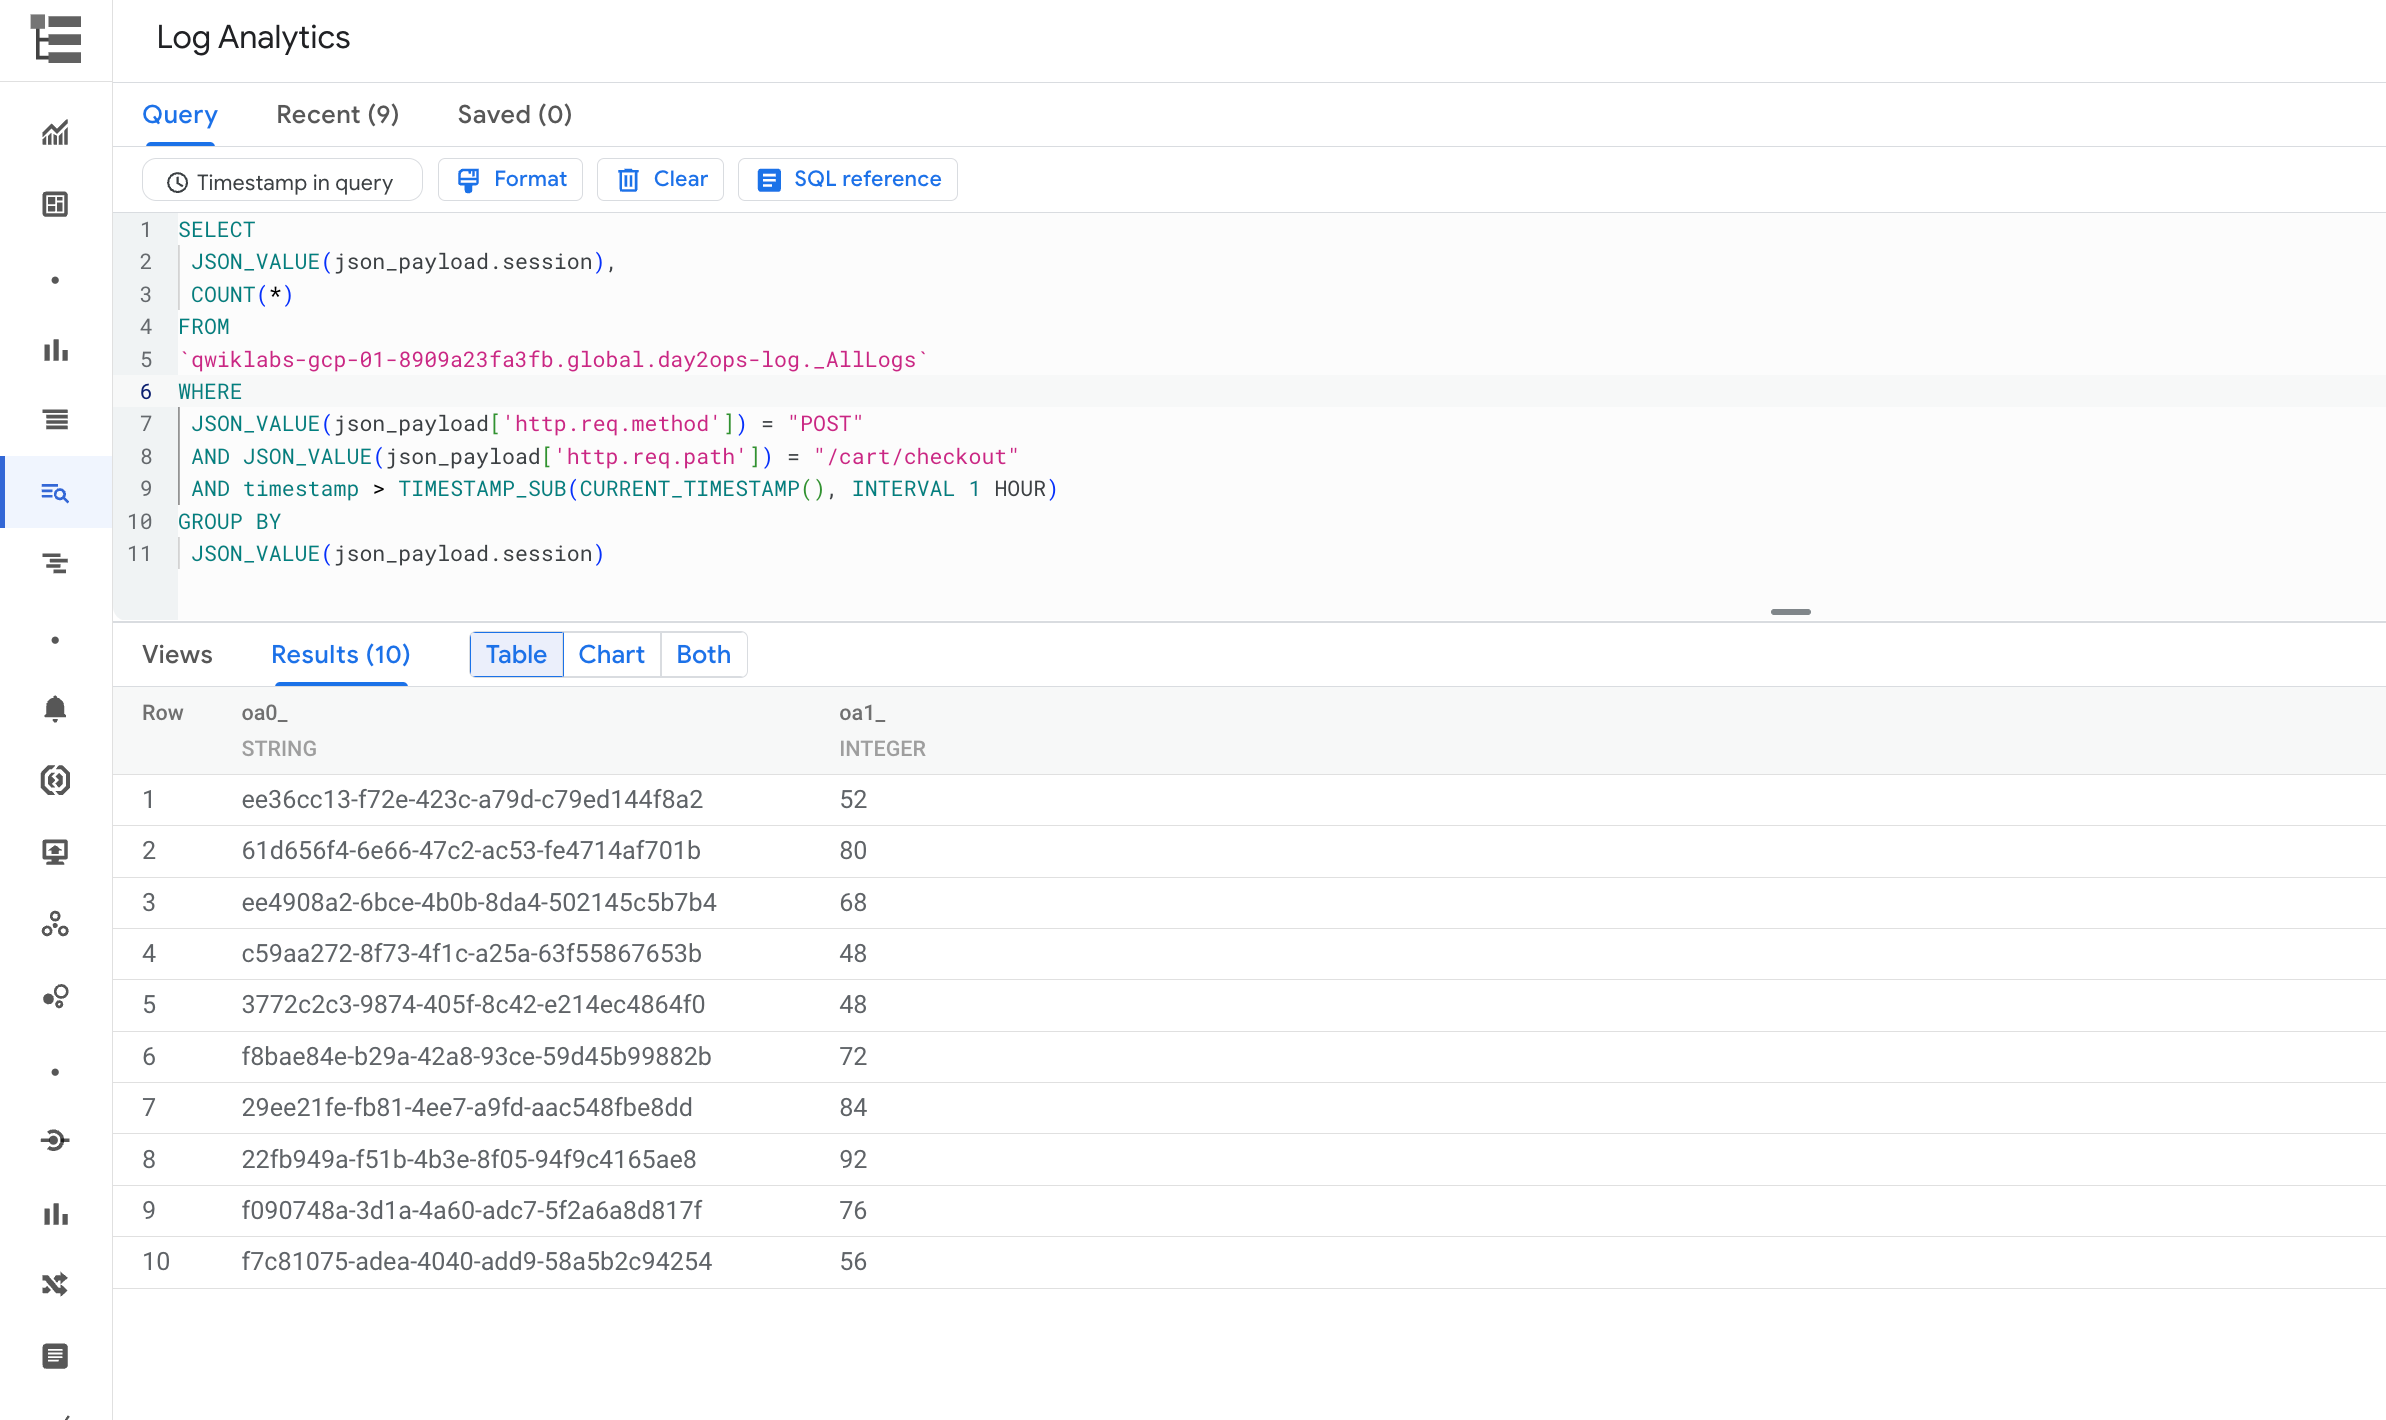
Sessions with shopping cart checkout
You can run the following query to view how many sessions end up with checkout (POST call to the /cart/checkout service):
SELECT
 JSON_VALUE(json_payload.session),
 COUNT(*)
FROM
 `qwiklabs-gcp-03-57b96a44bfe3.global.day2ops-log._AllLogs`
WHERE
 JSON_VALUE(json_payload['http.req.method']) = "POST"
 AND JSON_VALUE(json_payload['http.req.path']) = "/cart/checkout"
 AND timestamp > TIMESTAMP_SUB(CURRENT_TIMESTAMP(), INTERVAL 1 HOUR)
GROUP BY
 JSON_VALUE(json_payload.session)
After run the query, you should see the output like the following:
Solution of Lab
New Solution
curl -LO raw.githubusercontent.com/ePlus-DEV/storage/refs/heads/main/labs/GSP1088/lab.sh
source lab.sh
Script Alternative
curl -LO raw.githubusercontent.com/prateekrajput08/Arcade-Google-Cloud-Labs/refs/heads/main/Log%20Analytics%20on%20Google%20Cloud/TechCode.sh
sudo chmod +x TechCode.sh
./TechCode.sh
Task 3:

day2ops-log

Old Solution
export ZONE=
export REGION=


curl -LO https://raw.githubusercontent.com/ePlus-DEV/storage/main/labs/GSP1088/task-1-n-2.sh
sudo chmod +x task-1-n-2.sh
./task-1-n-2.sh

