Monitor an Apache Web Server using Ops Agent - GSP1108
D
A passionate full-stack developer from @ePlus.DEV
Search for a command to run...
A passionate full-stack developer from @ePlus.DEV
No comments yet. Be the first to comment.
Quick and practical tips to help users optimize tasks, improve skills, and solve common problems effectively across various areas like tech, lifestyle, productivity, and more.
Challenge overview In a challenge lab you’re given a scenario and a set of tasks. Instead of following step-by-step instructions, you will use the skills learned from the labs in the course to figure
Một bản tin giúp Developer cập nhật nhanh AI, Cloud, Open Source và những công nghệ đáng chú ý trong ngày. 📌 Executive Summary OpenAI công bố mười kết quả mới cho các bài toán lâu năm trong toán h

Một bản tin giúp Developer cập nhật nhanh AI, Cloud, Open Source và những công nghệ đáng chú ý trong ngày. 📌 Executive Summary OpenAI công bố mười kết quả mới cho các bài toán lâu năm trong toán h

Một bản tin giúp Developer cập nhật nhanh AI, Cloud, Open Source và những công nghệ đáng chú ý trong ngày. 📌 Executive Summary GitHub thử nghiệm policy theo enterprise team, cho phép cấp thêm mode

Một bản tin giúp Developer cập nhật nhanh AI, Cloud, Open Source và những công nghệ đáng chú ý trong ngày. 📌 Executive Summary OpenAI giảm mạnh giá GPT-5.6 Luna và Terra, đồng thời chuyển Priority

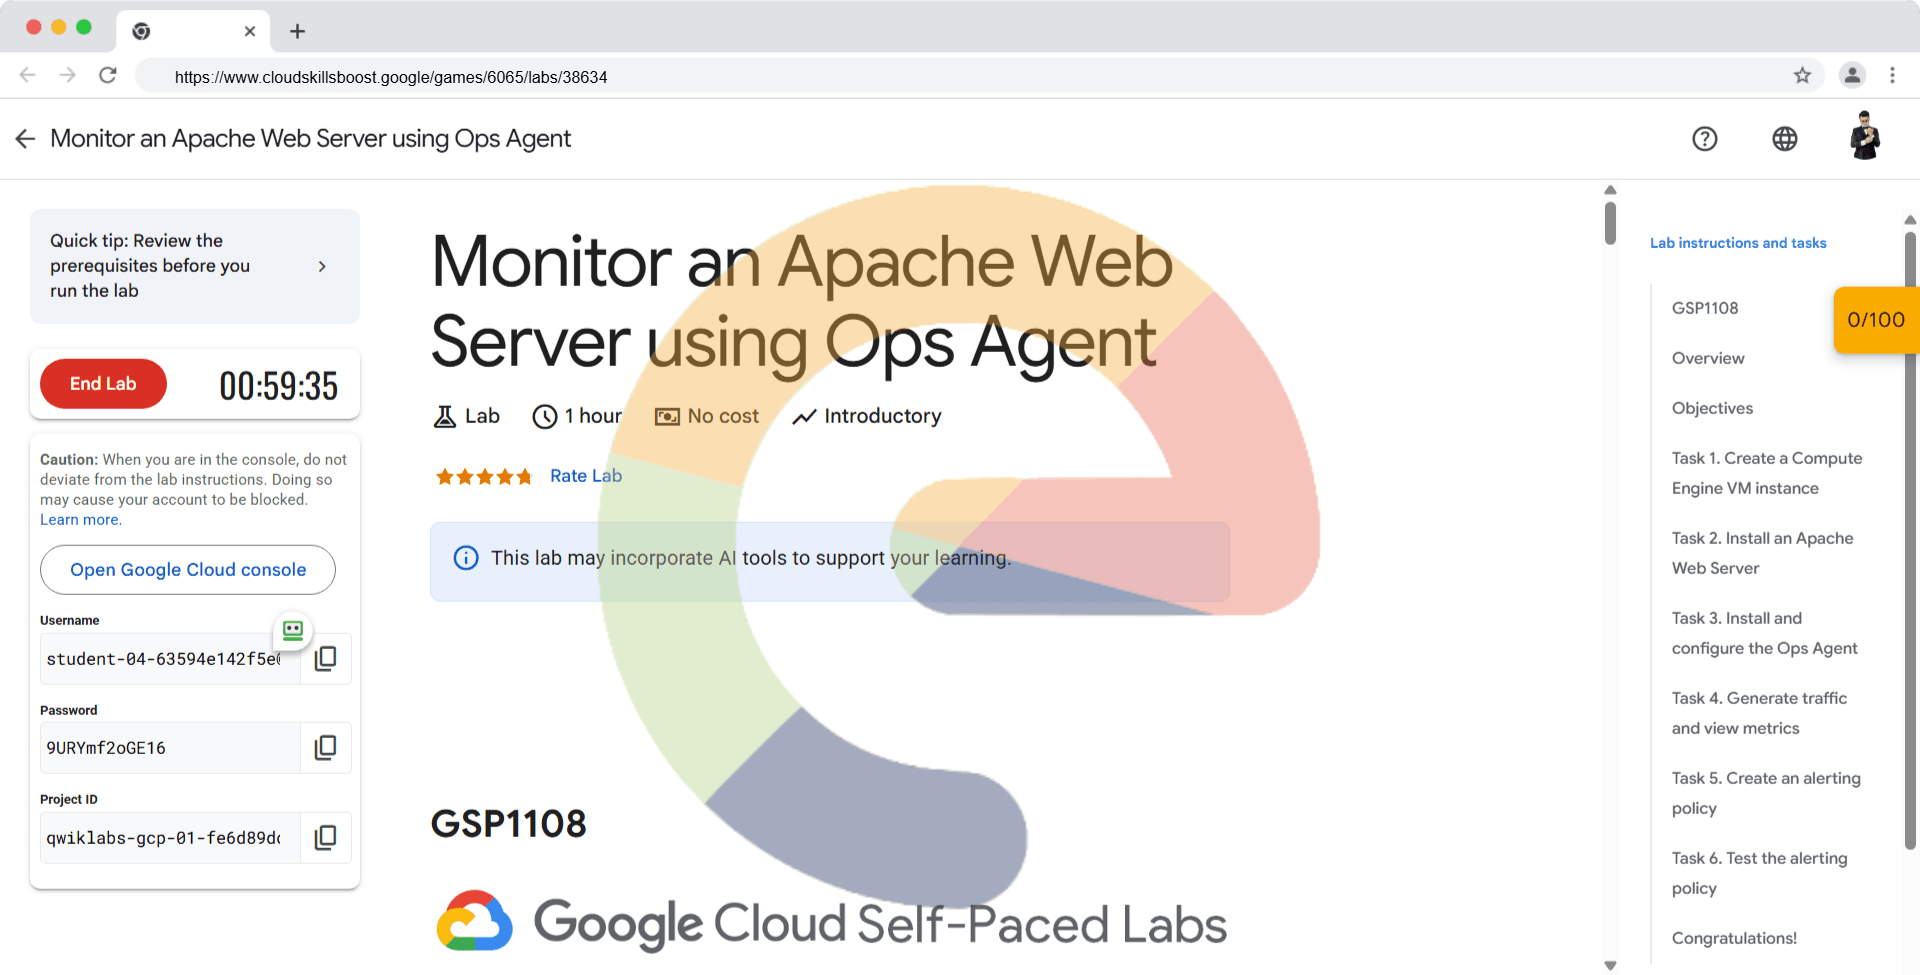
In this lab you use Cloud Monitoring to generate traffic and view metrics on the predefined Apache dashboard in the Google Cloud console.
The Apache Web Server integration collects traffic-related metrics, such as the number of open connections or incoming requests. The integration also collects access and error logs. Access logs are parsed into a JSON payload focused on request details, and error logs are parsed for their error code and message.
In this lab, you learn how to perform the following tasks:
Create a Compute Engine VM instance.
Install an Apache Web Server.
Install and configure the Ops Agent for the Apache Web Server.
Generate traffic and view metrics on the predefined Apache dashboard.
Create an alerting policy.
In the Google Cloud console, select Navigation menu > Compute Engine > VM Instances.
To create a VM instance, click Create Instance.
In the Machine configuration.
Select the following values:
| Property | Value (type value or select option as specified) |
| --- | --- |
| Name | quickstart-vm |
| Zone | us-west1-a |
| Series | E2 |
| Machine Type | e2-small |
Click OS and storage.
Click Change to begin configuring your boot disk:
Click Select.
Click Networking.
Click Create. When your VM is ready, it appears in the list of instances in the Instances tab.
Click Check my progress to verify the objective.
Create a Compute Engine VM instance
Check my progress
To deploy an Apache Web Server on your Compute Engine VM instance, do the following:
Open a terminal to your instance, by clicking the SSH button.
Update the package lists on your instance by running the following:
sudo apt-get update
sudo apt-get install apache2 php7.0
Note: If the previous command fails, then use sudo apt-get install apache2 php. If asked to continue the installation, enter Y.
Copy the address in the External IP column of your VM instance.
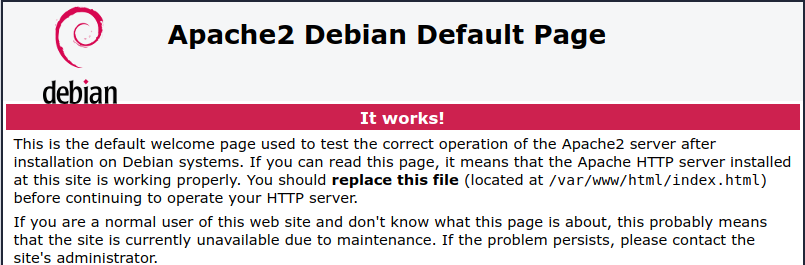
Open your browser and connect to your Apache2 HTTP server by using the URL http://EXTERNAL_IP, where EXTERNAL_IP is the external IP address of your VM.
Note: If you get a pop-up as EXTERNAL_IP doesn’t support a secure connection click Continue to site
Click Check my progress to verify the objective.
Install an Apache Web Server
Check my progress
The following commands create the configuration to collect and ingest telemetry for Apache Web Server and restart the Ops Agent by using the terminal:
curl -sSO https://dl.google.com/cloudagents/add-google-cloud-ops-agent-repo.sh
sudo bash add-google-cloud-ops-agent-repo.sh --also-install
You should notice the google-cloud-ops-agent installation succeeded.
# Configures Ops Agent to collect telemetry from the app and restart Ops Agent.

set -e

# Create a back up of the existing file so existing configurations are not lost.
sudo cp /etc/google-cloud-ops-agent/config.yaml /etc/google-cloud-ops-agent/config.yaml.bak

# Configure the Ops Agent.
sudo tee /etc/google-cloud-ops-agent/config.yaml > /dev/null << EOF
metrics:
  receivers:
    apache:
      type: apache
  service:
    pipelines:
      apache:
        receivers:
          - apache
logging:
  receivers:
    apache_access:
      type: apache_access
    apache_error:
      type: apache_error
  service:
    pipelines:
      apache:
        receivers:
          - apache_access
          - apache_error
EOF

sudo service google-cloud-ops-agent restart
sleep 60
For more information about ingesting logs from the Apache Web Server, see Configure the Ops Agent for Apache Web Server.
Click Check my progress to verify the objective.
Install the Ops Agent
Check my progress
Monitoring dashboards lets you view and analyze metrics related to your services. In this lab, you generate metrics on your Apache Web Server and view metric data on the automatically created Apache Overview dashboard.
timeout 120 bash -c -- 'while true; do curl localhost; sleep $((RANDOM % 4)) ; done'
The previous command generates traffic by making a request to the Apache Web Server every four seconds.
To view the Apache Overview dashboard, do the following:
In the console, search for Monitoring in the top search bar and navigate to the Monitoring service.
In the navigation pane, select Dashboards.
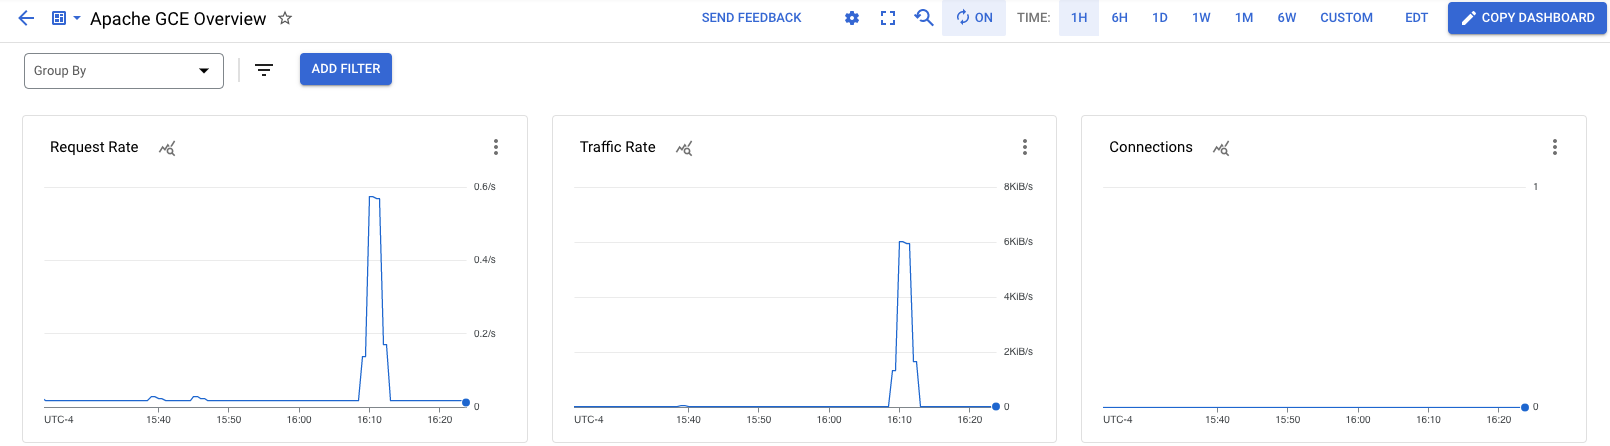
In All Dashboards, select the Apache Overview dashboard. The Apache GCE Overview dashboard opens.
In the dashboard, there are several charts that contain information about your Apache and Compute Engine integration:
Alerting policies instruct Cloud Monitoring to notify you when specified conditions occur.
To set up an email notification channel, do the following:
In Google Cloud console, select Navigation menu > Monitoring select Alerting and then click Edit notification channels.
Scroll down the page and click on Add new for Email.
Name the Email Channel: An email address you have access to
Enter the Display name.
Click Save.
Note: If you enter your own email address, you might get alerts until all the resources in the project have been deleted.
To create an alerting policy that monitors a metric and sends an email notification when the traffic rate on your Apache Web Server exceeds 4 KiB/s, do the following:
In Google Cloud console, select Navigation menu > Monitoring > Alerting and then click Create policy.
Select the time series to be monitored:
Click Select a metric and enter VM instance into the filter bar.
In the Active metric categories list, select Apache.
In the Active metrics list, select workload/apache.traffic. Click Apply.
The chart for Apache traffic is shown.
In the Transform data section, select the following values and click Next:
Rolling window: 1 min
Rolling window function: rate
In the Configure alert trigger section, select the following values and click Next:
Alert trigger: Any time series violates
Threshold position: Above threshold
Threshold value: 4000
In the Configure notifications and finalize alert section, select the following values:
Notification channels: Select the Display name you have created earlier and click OK.
Incident autoclose duration: 30 min
Name the alert policy: Apache traffic above threshold
Click Create policy. Your alerting policy is now active.
Click Check my progress to verify the objective.
Create an alerting policy
Check my progress
To test the alerting policy you just created, do the following:
In console, select Navigation menu > Compute Engine.
In the Connect column, click SSH to open a terminal to your VM instance.
In the terminal, enter the following command:
timeout 120 bash -c -- 'while true; do curl localhost; sleep $((RANDOM % 4)) ; done'
The previous command generates traffic in your Apache Web Server.
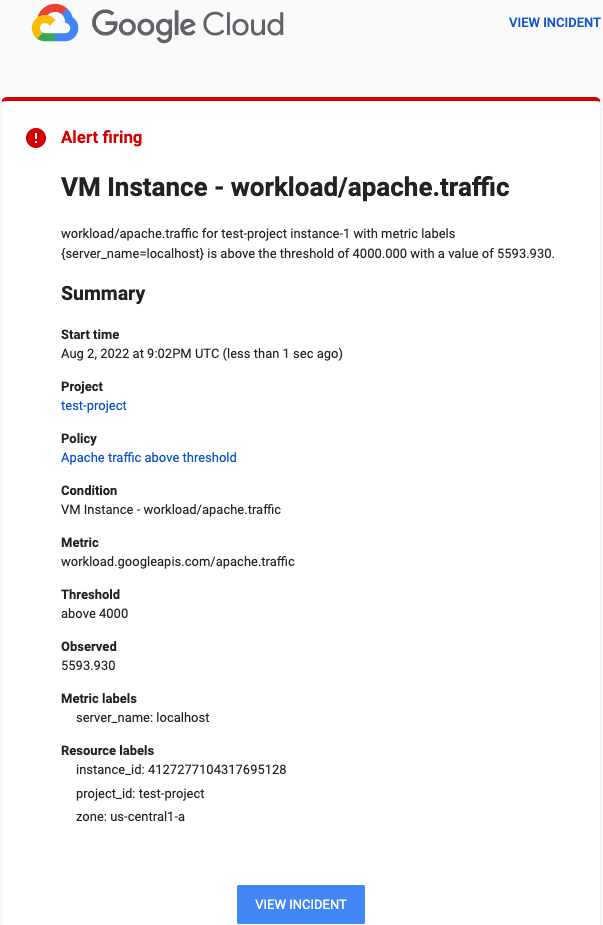
After the traffic rate threshold value of 4 KiB/s is exceeded in your Apache Web Server, an email notification is sent. It might take several minutes for this process to complete.
The email notification you receive looks similar to the following:
curl -LO raw.githubusercontent.com/ePlus-DEV/storage/refs/heads/main/labs/GSP1108/lab.sh
source lab.sh
Script Alternative
curl -LO https://raw.githubusercontent.com/AnonymousOlix/My-Qwick-Lab-Resources/refs/heads/main/GSP/myqwiklab-gsp1108.sh
sudo chmod +x myqwiklab-gsp1108.sh
./myqwiklab-gsp1108.sh