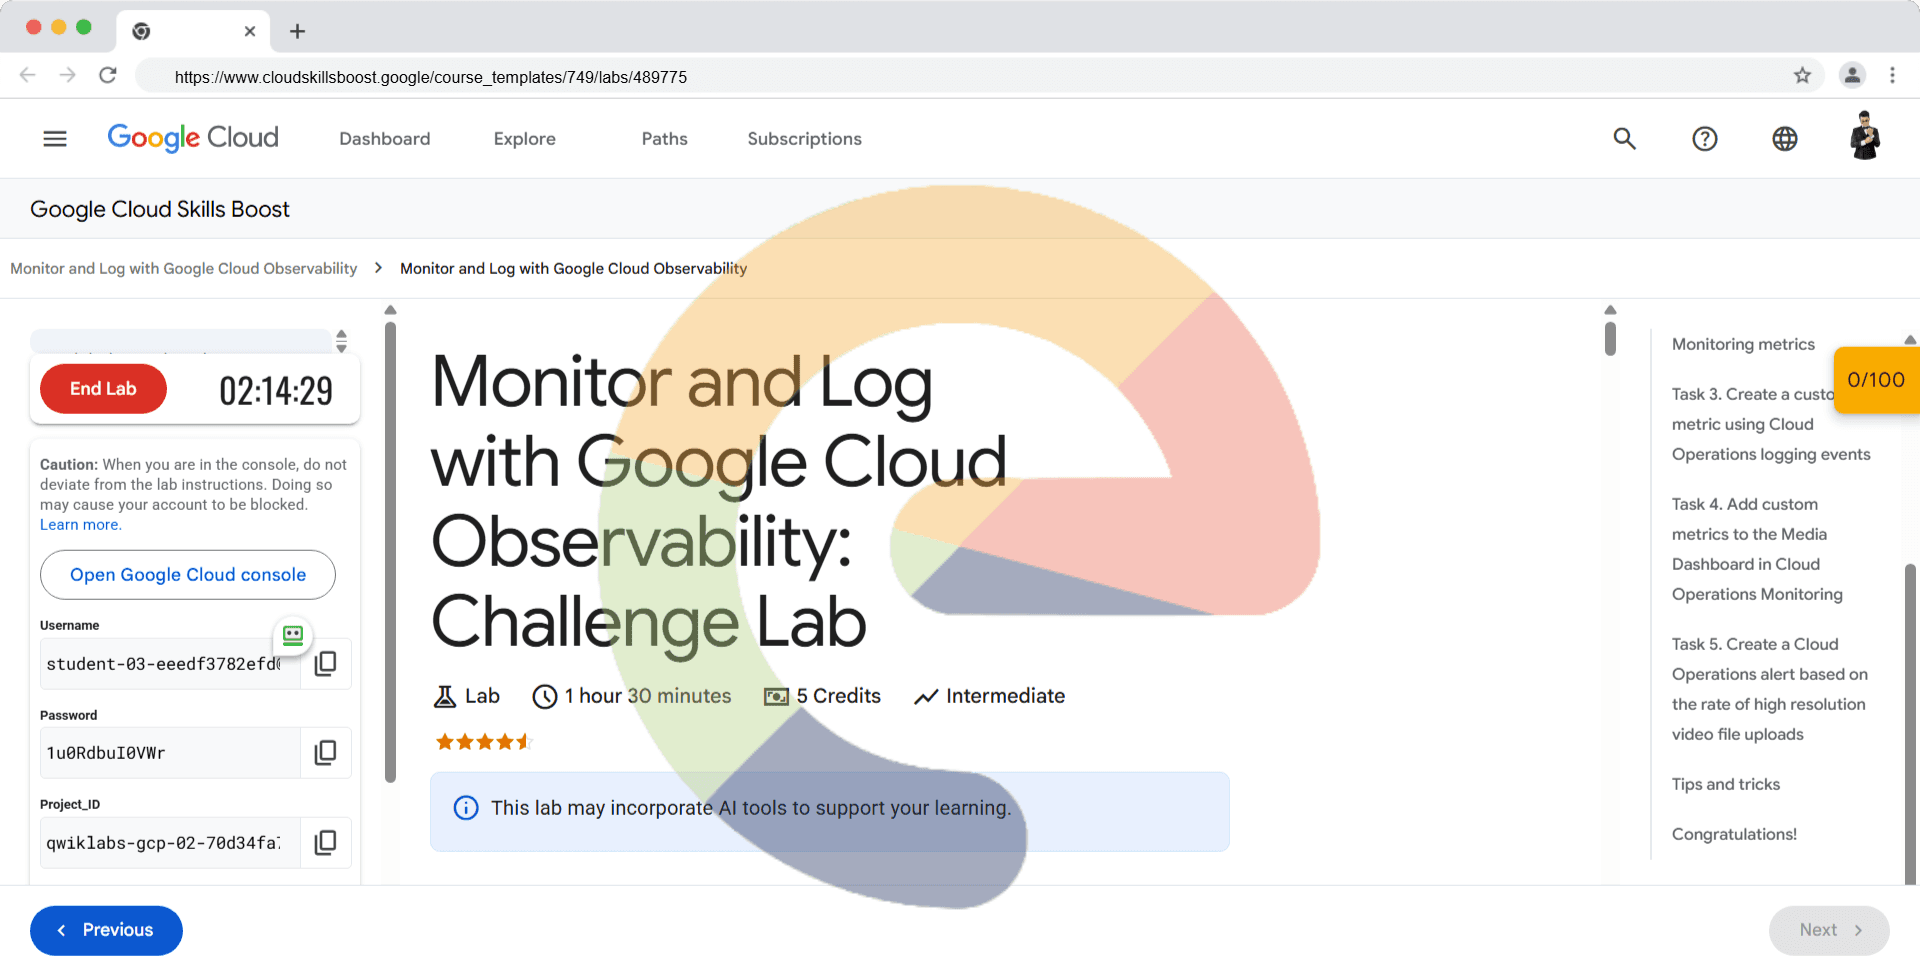
Monitor and Log with Google Cloud Observability: Challenge Lab - GSP338
A passionate full-stack developer from @ePlus.DEV
Overview
In a challenge lab you’re given a scenario and a set of tasks. Instead of following step-by-step instructions, you will use the skills learned from the labs in the course to figure out how to complete the tasks on your own! An automated scoring system (shown on this page) will provide feedback on whether you have completed your tasks correctly.
When you take a challenge lab, you will not be taught new Google Cloud concepts. You are expected to extend your learned skills, like changing default values and reading and researching error messages to fix your own mistakes.
To score 100% you must successfully complete all tasks within the time period!
This lab is recommended for students enrolled in the Monitor and Log with Google Cloud Observability course. Are you ready for the challenge?
Topics tested:
Initialize Cloud Monitoring.
Configure a Compute Engine application for Cloud Operations Monitoring custom metrics.
Create a custom metric using Cloud Operations logging events.
Add custom metrics to a Cloud Monitoring Dashboard.
Create a Cloud Operations alert.
Note: The lab startup procedure deploys a Cloud Function that you will use throughout the lab. You can start the lab without waiting for this to complete as the first few tasks do not depend on the Cloud Function.
Setup
Before you click the Start Lab button
Read these instructions. Labs are timed and you cannot pause them. The timer, which starts when you click Start Lab, shows how long Google Cloud resources are made available to you.
This hands-on lab lets you do the lab activities in a real cloud environment, not in a simulation or demo environment. It does so by giving you new, temporary credentials you use to sign in and access Google Cloud for the duration of the lab.
To complete this lab, you need:
- Access to a standard internet browser (Chrome browser recommended).
Note: Use an Incognito (recommended) or private browser window to run this lab. This prevents conflicts between your personal account and the student account, which may cause extra charges incurred to your personal account.
- Time to complete the lab—remember, once you start, you cannot pause a lab.
Note: Use only the student account for this lab. If you use a different Google Cloud account, you may incur charges to that account.
Challenge scenario
In your new role as Junior Cloud Engineer for Jooli Inc., you're expected to help manage the Cloud infrastructure components and support the video operations team. Common tasks include monitoring resource utilization, analyzing logs, configuring alerts, and reporting on any issues related to Jooli Inc.'s online services.
As you're expected to have the skills and knowledge for these tasks, step-by-step guides are not provided.
Some Jooli Inc. standards you should follow:
Create all resources in the
us-east1region andus-east1-bzone, unless otherwise directed.Naming is team-resource, e.g. an instance could be named video-webserver1.
Allocate cost effective resource sizes. Projects are monitored and excessive resource use will result in the containing project's termination (and possibly yours), so beware. Unless directed, use
e2-medium.
Your challenge
On the first day of your new job, your manager gives you a series of tasks that you must complete. Good luck!
Your primary concern is a media upload function that Jooli Inc. provides. This function allows subscribers to upload video content to edit and transform using Jooli Inc.'s innovative range of cloud based media production tools.
The media upload function is a critical part of the service, and it is vital that Jooli Inc. is aware of any changes in the behavior of the users that might impact performance or cost of the services.
Your tasks today will use Cloud Operations tools to improve the company's ability to identify such changes and respond to them rapidly. Your manager has told you that the company is concerned that recent changes in end user behavior, combined with a new generation of phones and tablets, is fuelling a demand for much higher media such as 4K, and even 8K, video. Storage for the data is a relatively minor concern but the company wants to make sure that resource consumption by the Cloud Functions used for media upload and transcoding do not run into any limits or result in unexpected spikes in billing costs.
Task 1. Configure Cloud Monitoring
- Your first task is to enable Cloud Monitoring for your project.
A basic Cloud Monitoring dashboard, called Media_Dashboard, will be made available to you automatically, but you have to enable Cloud Monitoring in your project before you will be able to access this dashboard.
Click Check my progress to verify the objective.
Check that Cloud Monitoring is enabled.
Check my progress
Once you initialize Cloud Monitoring, you can access the initial dashboard, called Media_Dashboard. In subsequent tasks you will add custom metrics to this basic dashboard. The initial dashboard configuration includes some charts that display stats about the latency of the video upload Cloud Function.
Task 2. Configure a Compute Instance to generate Custom Cloud Monitoring metrics
- Your next task is to confirm that the monitoring service that checks the length of the video processing queue is working correctly.
The monitoring service creates a custom metric, opencensus/my.videoservice.org/measure/input_queue_size, that allows you to monitor the state of the Jooli Inc.'s video processing queue. This custom metric is created and written to by a Go application that runs on a Compute Instance called video-queue-monitor.
The video-queue-monitor Compute Instance has been deployed for you and uses a startup script to install and launch the input queue monitoring Go application. This application was tested fully in a development environment but the configuration in your Compute Instance has not been finalized. The Go application will not write custom metric data until the application is correctly configured by the startup script.
- You must modify the startup script for the video-queue-monitor Compute Instance so that the queue monitoring application (the Go application) can create and write to custom metrics. Once you have updated the startup script you will need to restart the instance.
The Go application is installed in the /work/go directory in the Compute Instance by the startup script.
- You can confirm that the application is working by searching for the metric
input_queue_sizein the Metrics Explorer in Cloud Monitoring.
Click Check my progress to verify the objective.
Check that the video input queue custom metric has been created.
Check my progress
Task 3. Create a custom metric using Cloud Operations logging events
Examine the Cloud Operations logs and create a custom metric that tracks the total volume of uploaded media files to your Cloud Function. The video upload Cloud Function creates a Cloud Operations Logging event that includes metadata about the type of video file the video processing system handles.
You have been asked to configure a custom log based metric called
huge_video_upload_ratethat will monitor the rate at which high resolution video files, those recorded at either 4K or 8K resolution, are uploaded.
The Cloud Function is already processing this data, and if you search the Cloud Operations logs using the advanced filter mode you will find log entries that contain the string "file_format: 4K" or "file_format: 8K" in the textPayload field whenever the video_processing Cloud Function receives a request to process a high resolution video. You can use that filter to create your custom metric.
Click Check my progress to verify the objective.
Check that a custom metric using Cloud Operations logging events has been created.
Check my progress
Task 4. Add custom metrics to the Media Dashboard in Cloud Operations Monitoring
You must now add two charts to the Media Dashboard:
Add a chart for the video input queue length custom metric that is generated by the Go application running on the video-queue-monitor Compute Instance.
Add a chart for the high resolution video upload rate custom log based metric to the Media_Dashboard custom dashboard.
Click Check my progress to verify the objective.
Check that two custom metrics have been added to the Media_Dashboard
Check my progress
Task 5. Create a Cloud Operations alert based on the rate of high resolution video file uploads
- Create a custom alert using the high resolution video upload metric that triggers when the upload rate for large videos exceeds a count of
5per second.
Click Check my progress to verify the objective.
Check that a Custom Alert has been created.
Check my progress
Tips and tricks
Tip 1. The startup script for the Compute Instance is in the Compute Instance metadata key called
startup_script.Tip 2. The Compute Instance must have the Cloud Monitoring agent installed and the Go application requires environment variables to be configured with the Google Cloud project, the instance ID, and the compute engine zone.
Tip 3. The Video Queue length monitoring Go application writes the queue length metric data to a metric called
custom.googleapis.com/opencensus/my.videoservice.org/measure/input_queue_sizeassociated with thegce_instanceresource type.Tip 4. To create the custom log based metric, the easiest filter to use is the advanced filter query
textPayload=~"file_format\: ([4,8]K).*". That is a regular expression that matches all Cloud Operations events for the two high resolution video formats you are interested in. You can use the same regular expression and configure labels in the metric definition, which creates a separate time series for each of the two high resolution formats.Tip 5. You must use the name provided for the custom log based metric that monitors the rate at which high resolution videos are processed:
huge_video_upload_rate.
Solution of Lab
export METRIC=
export VALUE=

curl -LO raw.githubusercontent.com/ePlus-DEV/storage/refs/heads/main/labs/GSP338/lab.sh
source lab.sh
Script Alternative
curl -LO raw.githubusercontent.com/QUICK-GCP-LAB/2-Minutes-Labs-Solutions/refs/heads/main/Monitor%20and%20Log%20with%20Google%20Cloud%20Observability%20Challenge%20Lab/gsp338.sh
sudo chmod +x gsp338.sh
./gsp338.sh


- Type or paste input_queue_size

- Type or paste large_video_upload_rate