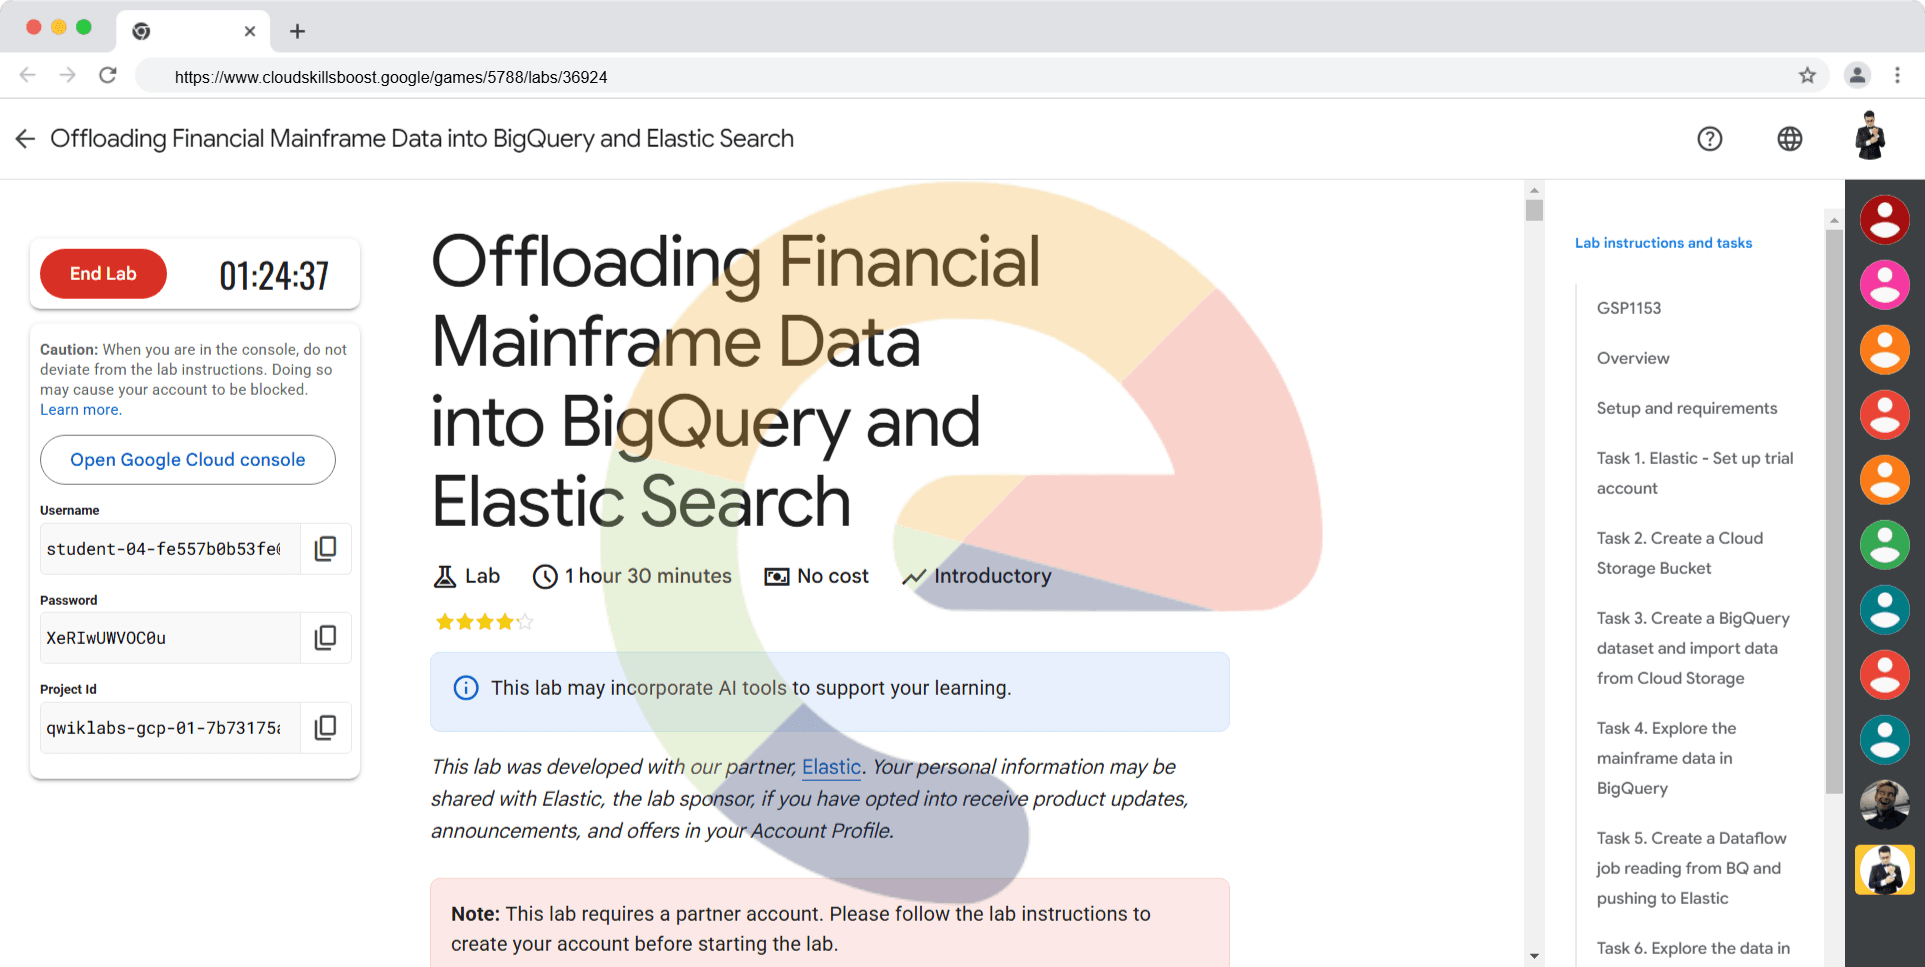
Offloading Financial Mainframe Data into BigQuery and Elastic Search - GSP1153
A passionate full-stack developer from @ePlus.DEV
Overview
Financial institutions have vast amounts of data about their customers. However, many of them struggle to leverage data to their advantage. Data may be sitting in silos or trapped on costly mainframes. Customers may only have access to a limited quantity of data, or service providers may need to search through multiple systems of record to handle a simple customer inquiry. This creates a hazard for providers and a headache for customers.
Elastic and Google Cloud enable institutions to manage this information. Powerful search tools allow data to be surfaced faster than ever - Whether it's card payments, ACH (Automated Clearing House), wires, bank transfers, real-time payments, or another payment method. This information can be correlated to customer profiles, cash balances, merchant info, purchase history, and other relevant information to enable the customer or business objective.
In this hands-on lab, you'll import synthetic data representing financial records offloaded from a bank's mainframe into BigQuery. You'll then explore it using SQL, then create a Dataflow job to process and ingest a subset of that data into Elastic Search. Finally, you'll create a dashboard in Elastic's Kibana tool to gain a 360 degree view of a customer's financial history.
Objectives
Importing mainframe data into BigQuery and exploring it using SQL
Get an Elastic Trial and deploy an Elastic Cluster on Google Cloud
Creating a Dataflow job from an Elastic template
Running and monitoring a Dataflow job's progress
Inspecting datasets in Elastic with Kibana
Building a dashboard to visualize the mainframe data
Prerequisites
- Familiarity with SQL, Google Cloud and Elastic Search is not required but will be helpful
Setup and requirements
Before you click the Start Lab button
Read these instructions. Labs are timed and you cannot pause them. The timer, which starts when you click Start Lab, shows how long Google Cloud resources will be made available to you.
This hands-on lab lets you do the lab activities yourself in a real cloud environment, not in a simulation or demo environment. It does so by giving you new, temporary credentials that you use to sign in and access Google Cloud for the duration of the lab.
To complete this lab, you need:
- Access to a standard internet browser (Chrome browser recommended).
Note: Use an Incognito or private browser window to run this lab. This prevents any conflicts between your personal account and the Student account, which may cause extra charges incurred to your personal account.
- Time to complete the lab---remember, once you start, you cannot pause a lab.
Note: If you already have your own personal Google Cloud account or project, do not use it for this lab to avoid extra charges to your account.
How to start your lab and sign in to the Google Cloud console
Click the Start Lab button. If you need to pay for the lab, a dialog opens for you to select your payment method. On the left is the Lab Details pane with the following:
The Open Google Cloud console button
Time remaining
The temporary credentials that you must use for this lab
Other information, if needed, to step through this lab
Click Open Google Cloud console (or right-click and select Open Link in Incognito Window if you are running the Chrome browser).
The lab spins up resources, and then opens another tab that shows the Sign in page.
Tip: Arrange the tabs in separate windows, side-by-side.
Note: If you see the Choose an account dialog, click Use Another Account.
If necessary, copy the Username below and paste it into the Sign in dialog.
student-04-fe557b0b53fe@qwiklabs.netYou can also find the Username in the Lab Details pane.
Click Next.
Copy the Password below and paste it into the Welcome dialog.
XeRIwUWVOC0uYou can also find the Password in the Lab Details pane.
Click Next.
Important: You must use the credentials the lab provides you. Do not use your Google Cloud account credentials.
Note: Using your own Google Cloud account for this lab may incur extra charges.
Click through the subsequent pages:
Accept the terms and conditions.
Do not add recovery options or two-factor authentication (because this is a temporary account).
Do not sign up for free trials.
After a few moments, the Google Cloud console opens in this tab.
Note: To access Google Cloud products and services, click the Navigation menu or type the service or product name in the Search field.

Activate Cloud Shell
Cloud Shell is a virtual machine that is loaded with development tools. It offers a persistent 5GB home directory and runs on the Google Cloud. Cloud Shell provides command-line access to your Google Cloud resources.
Click Activate Cloud Shell at the top of the Google Cloud console.
Click through the following windows:
Continue through the Cloud Shell information window.
Authorize Cloud Shell to use your credentials to make Google Cloud API calls.
When you are connected, you are already authenticated, and the project is set to your Project_ID, qwiklabs-gcp-01-7b73175a164b. The output contains a line that declares the Project_ID for this session:
Your Cloud Platform project in this session is set to qwiklabs-gcp-01-7b73175a164b
gcloud is the command-line tool for Google Cloud. It comes pre-installed on Cloud Shell and supports tab-completion.
- (Optional) You can list the active account name with this command:
gcloud auth list
- Click Authorize.
Output:
ACTIVE: *
ACCOUNT: student-04-fe557b0b53fe@qwiklabs.net

To set the active account, run:
    $ gcloud config set account `ACCOUNT`
- (Optional) You can list the project ID with this command:
gcloud config list project
Output:
[core]
project = qwiklabs-gcp-01-7b73175a164b
Note: For full documentation of gcloud, in Google Cloud, refer to the gcloud CLI overview guide.
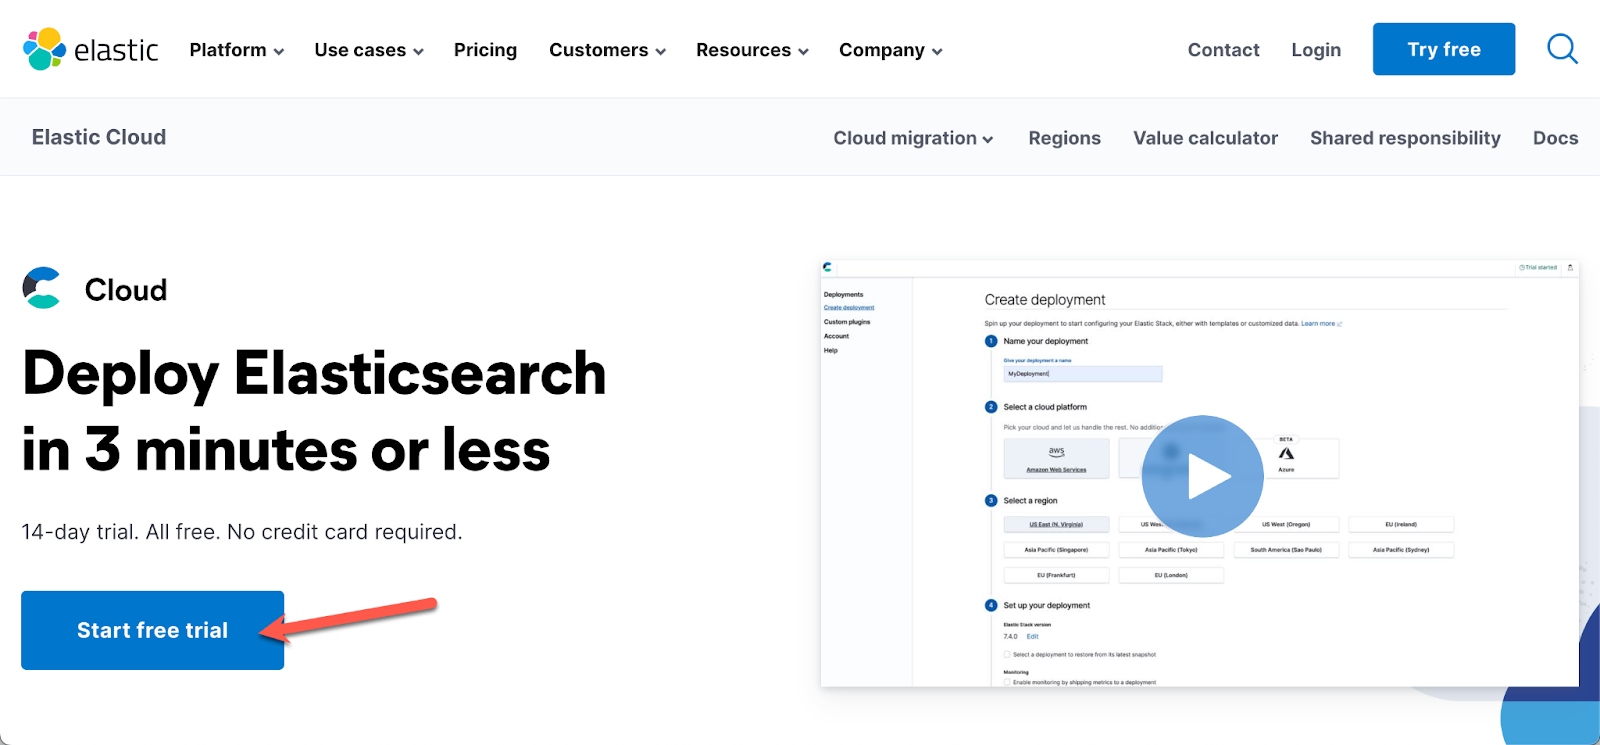
Task 1. Elastic - Set up trial account
- Sign up for a free trial.
- Click Start free trial.
- Sign up using your personal email and a unique password. Do NOT click the "sign up with Google" button:
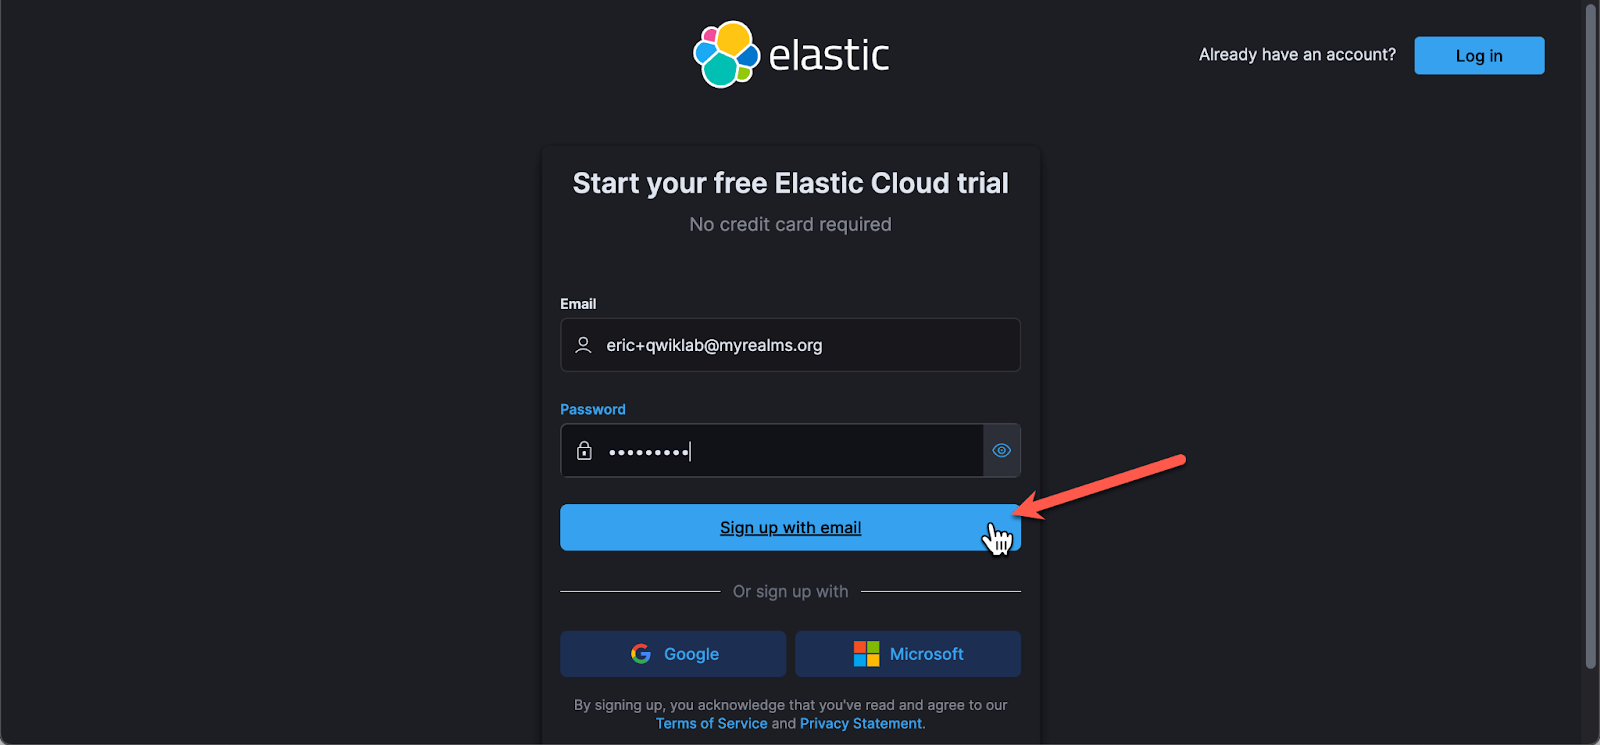
Note: You must use your personal email, not your student account, don't attempt to sign up with google, unless you sign out of your lab account first. If you attempt to sign up with your student id, your trial will be rejected or canceled.
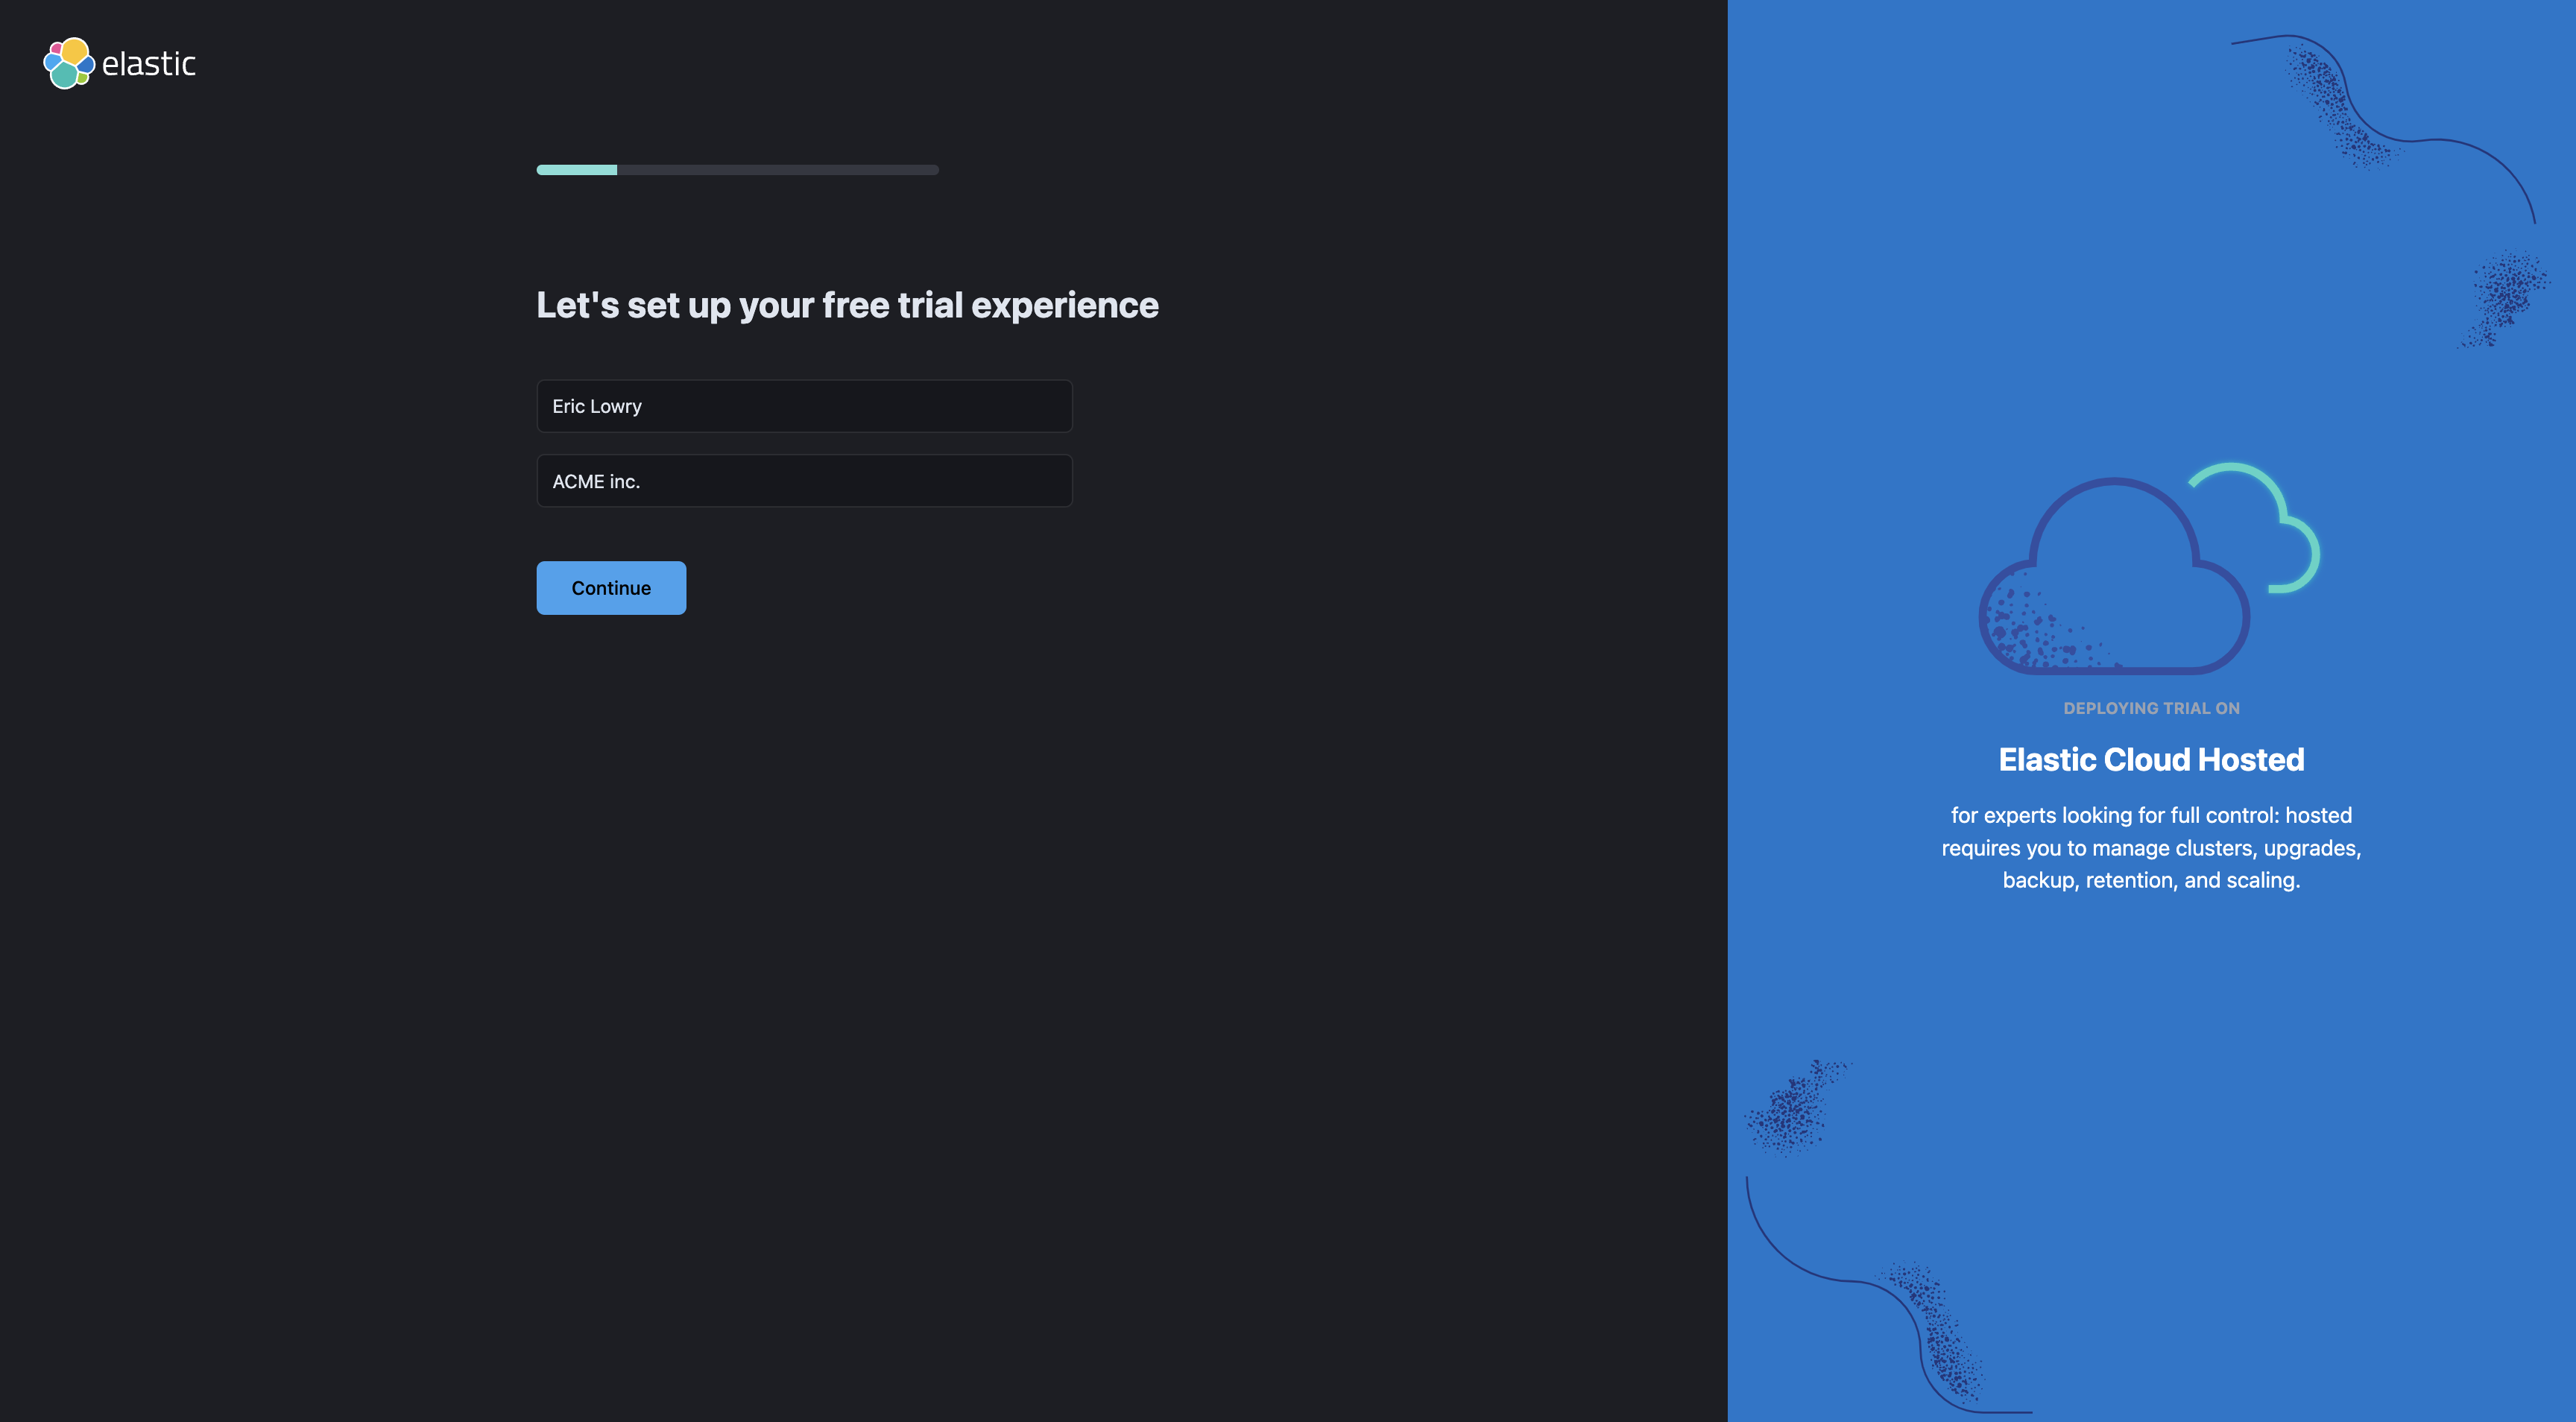
- Enter some details about yourself
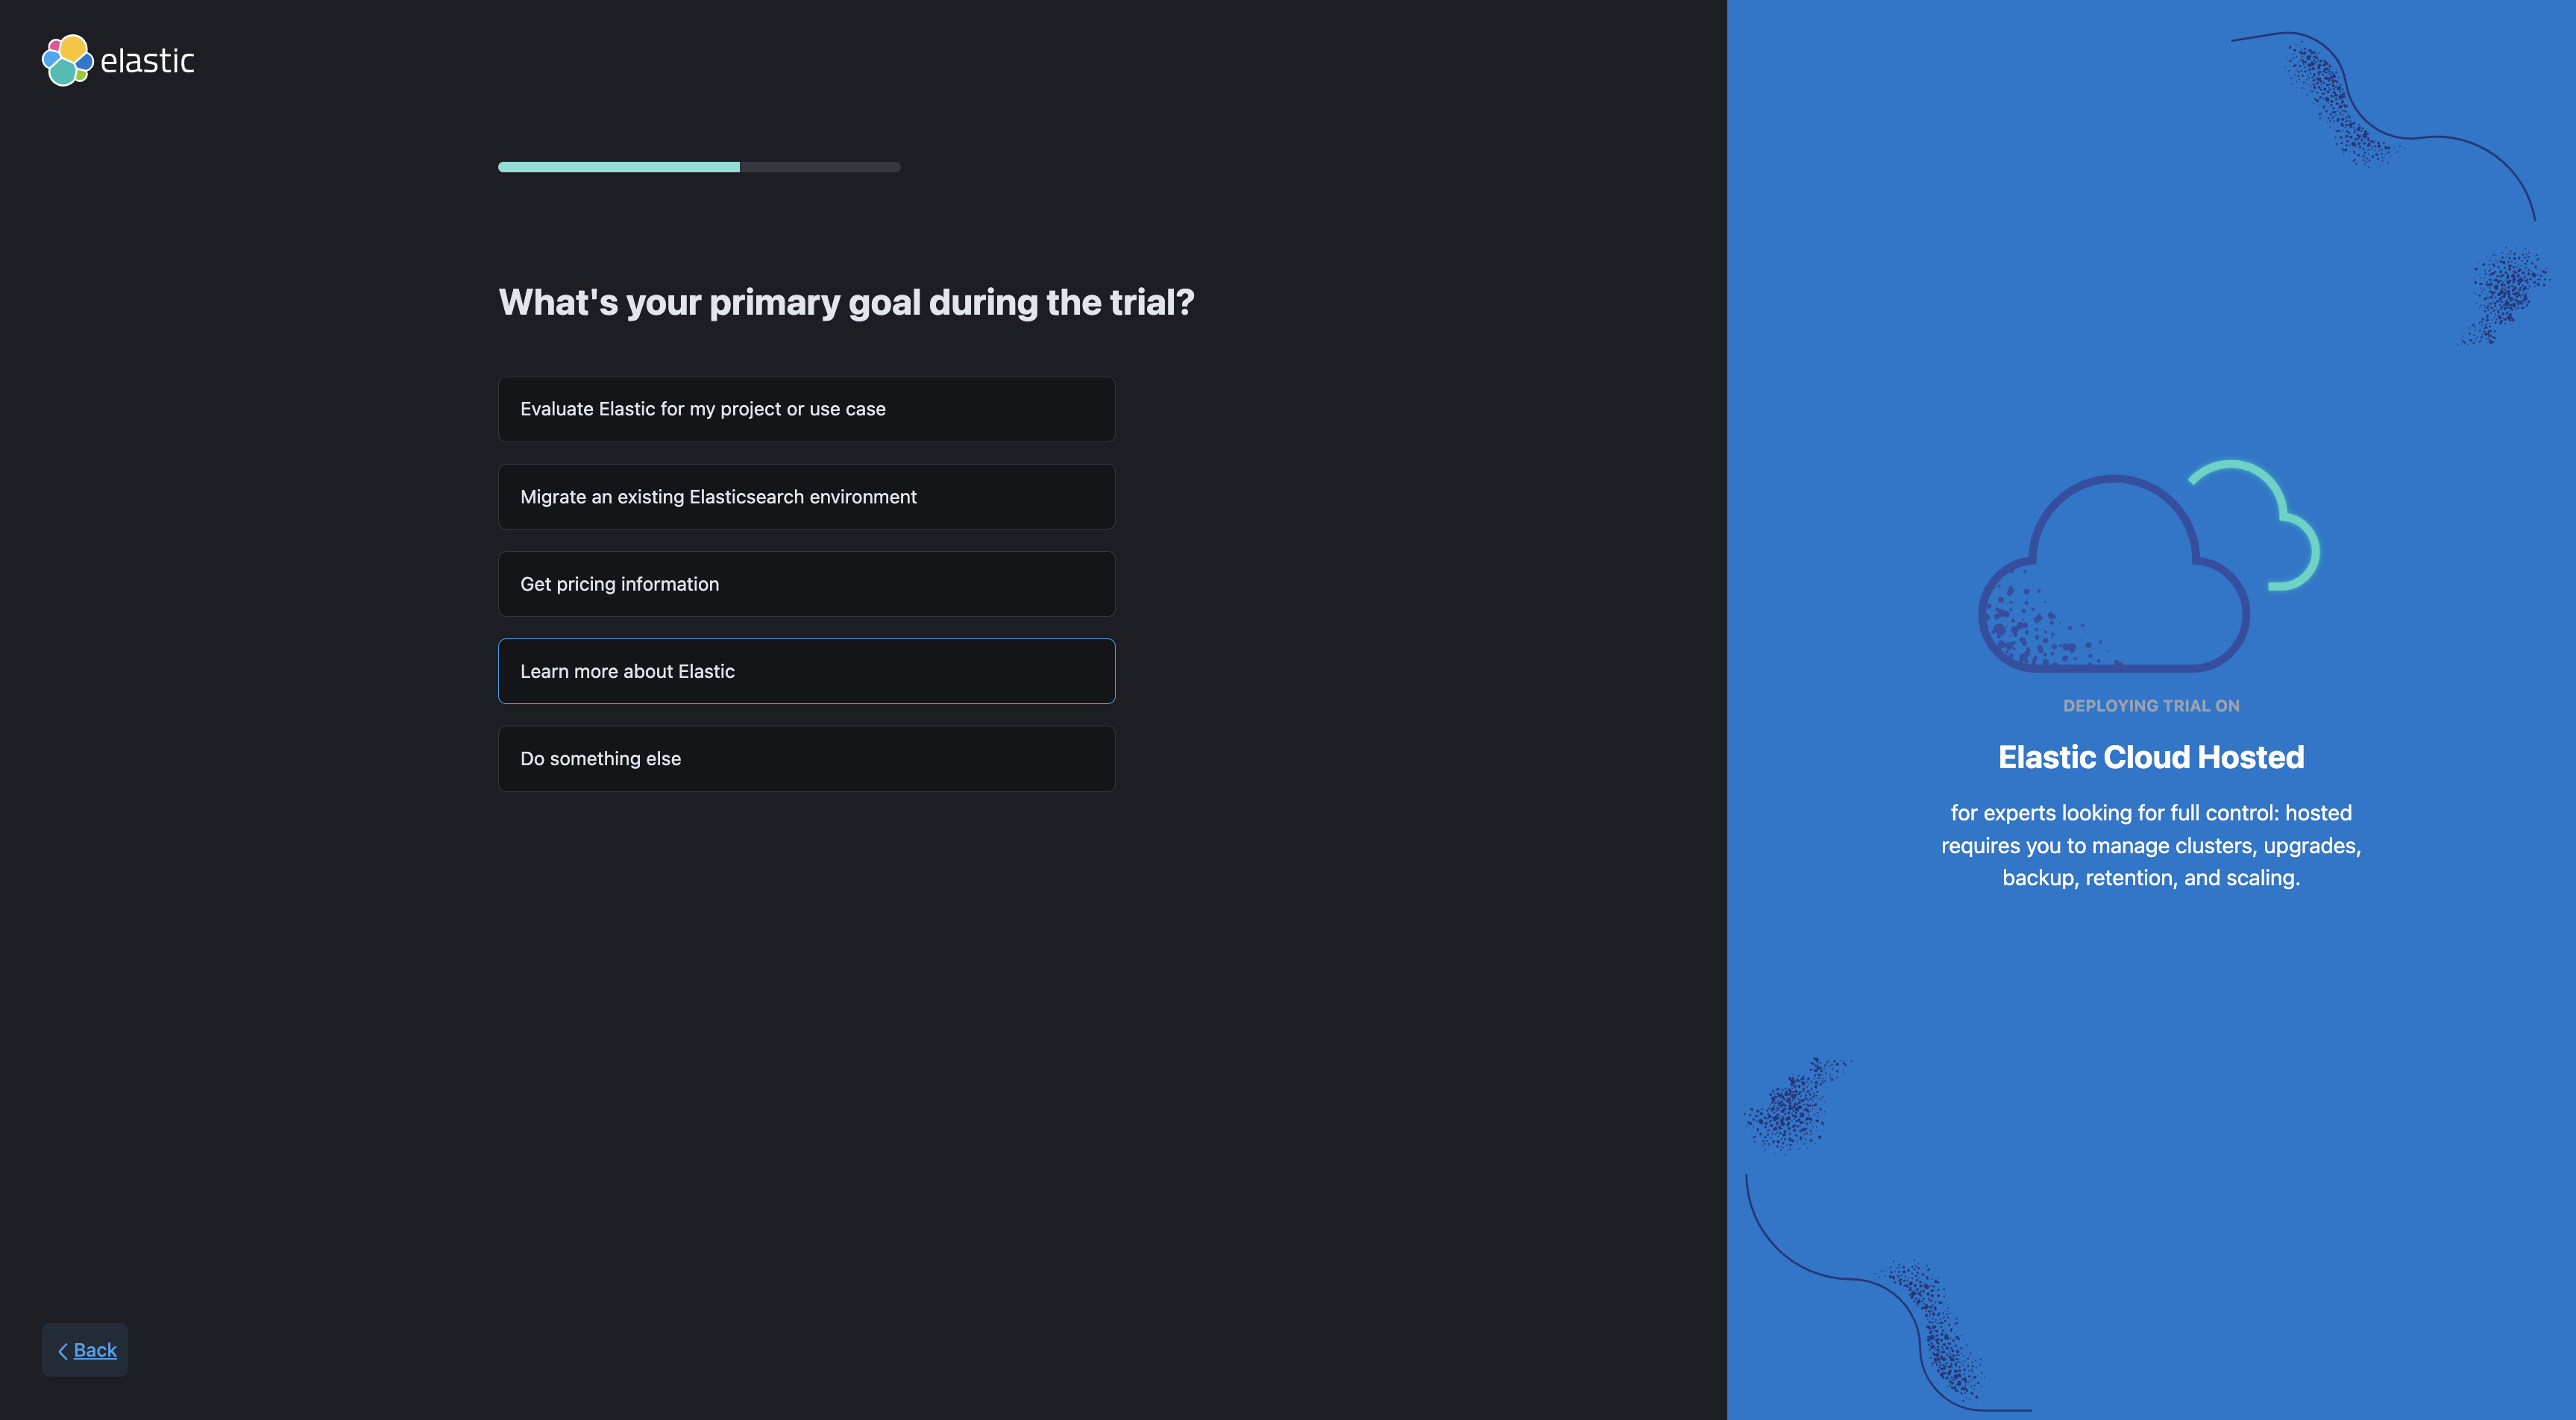
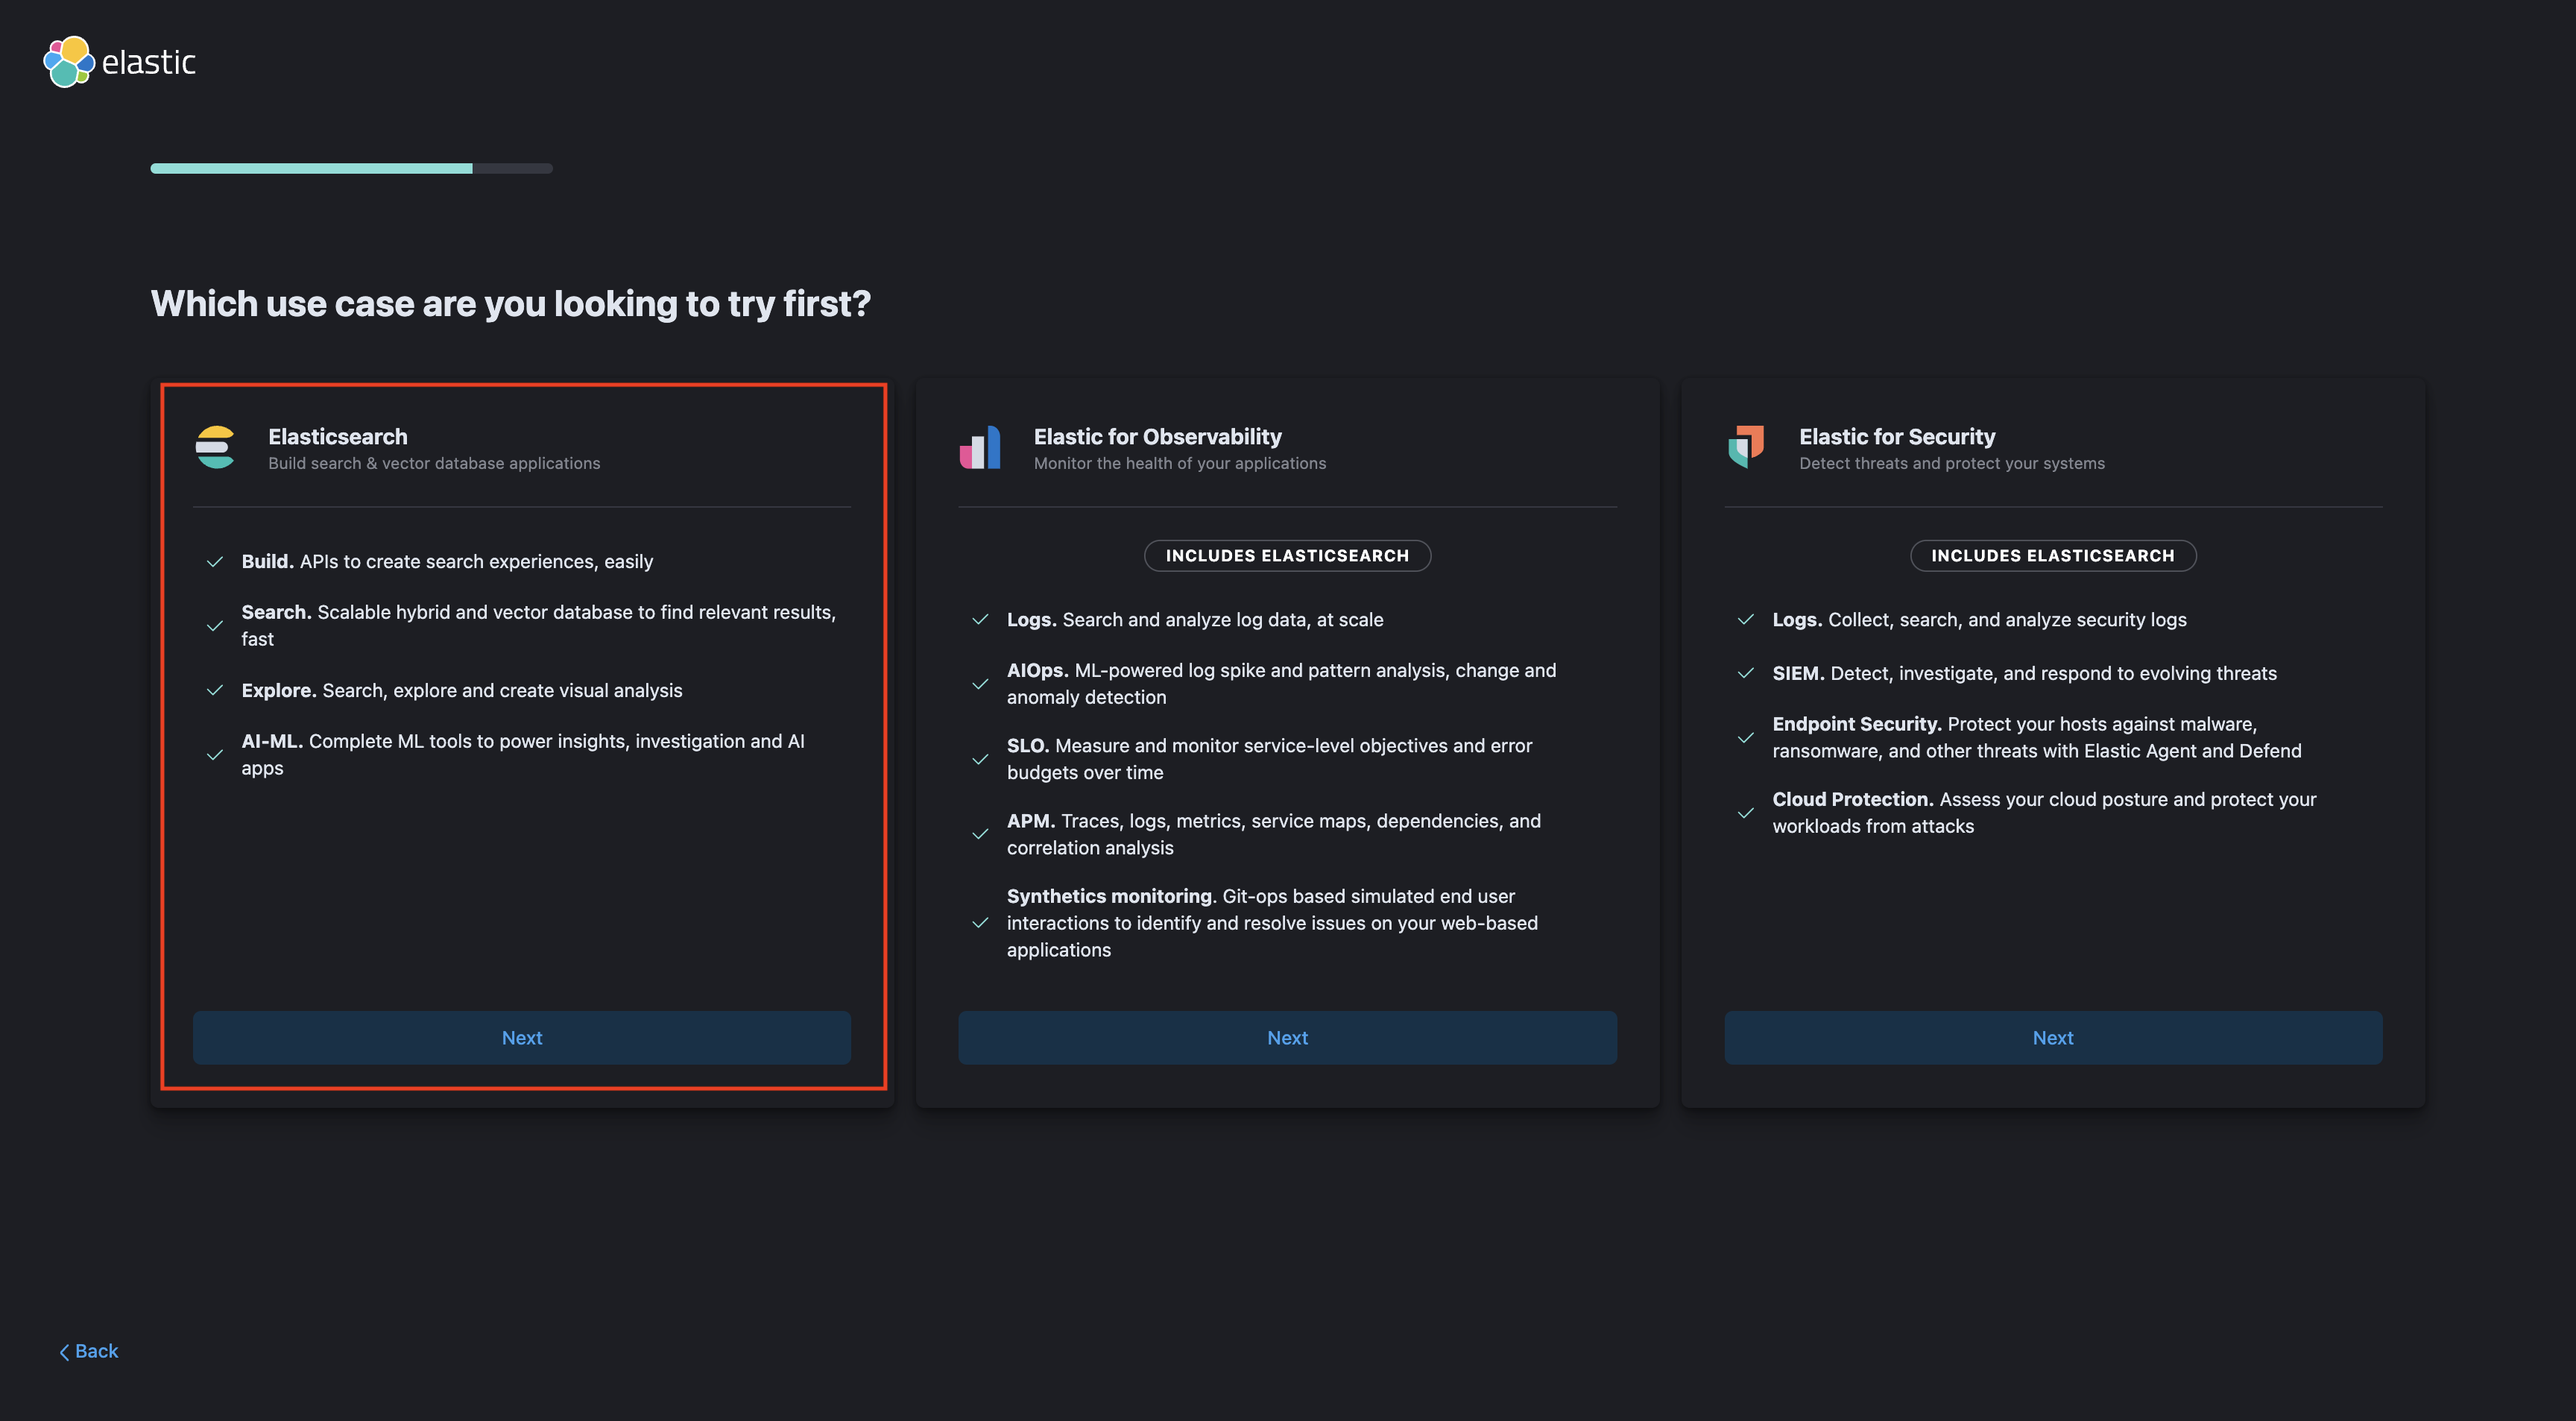
- Select use case as Elastic Search
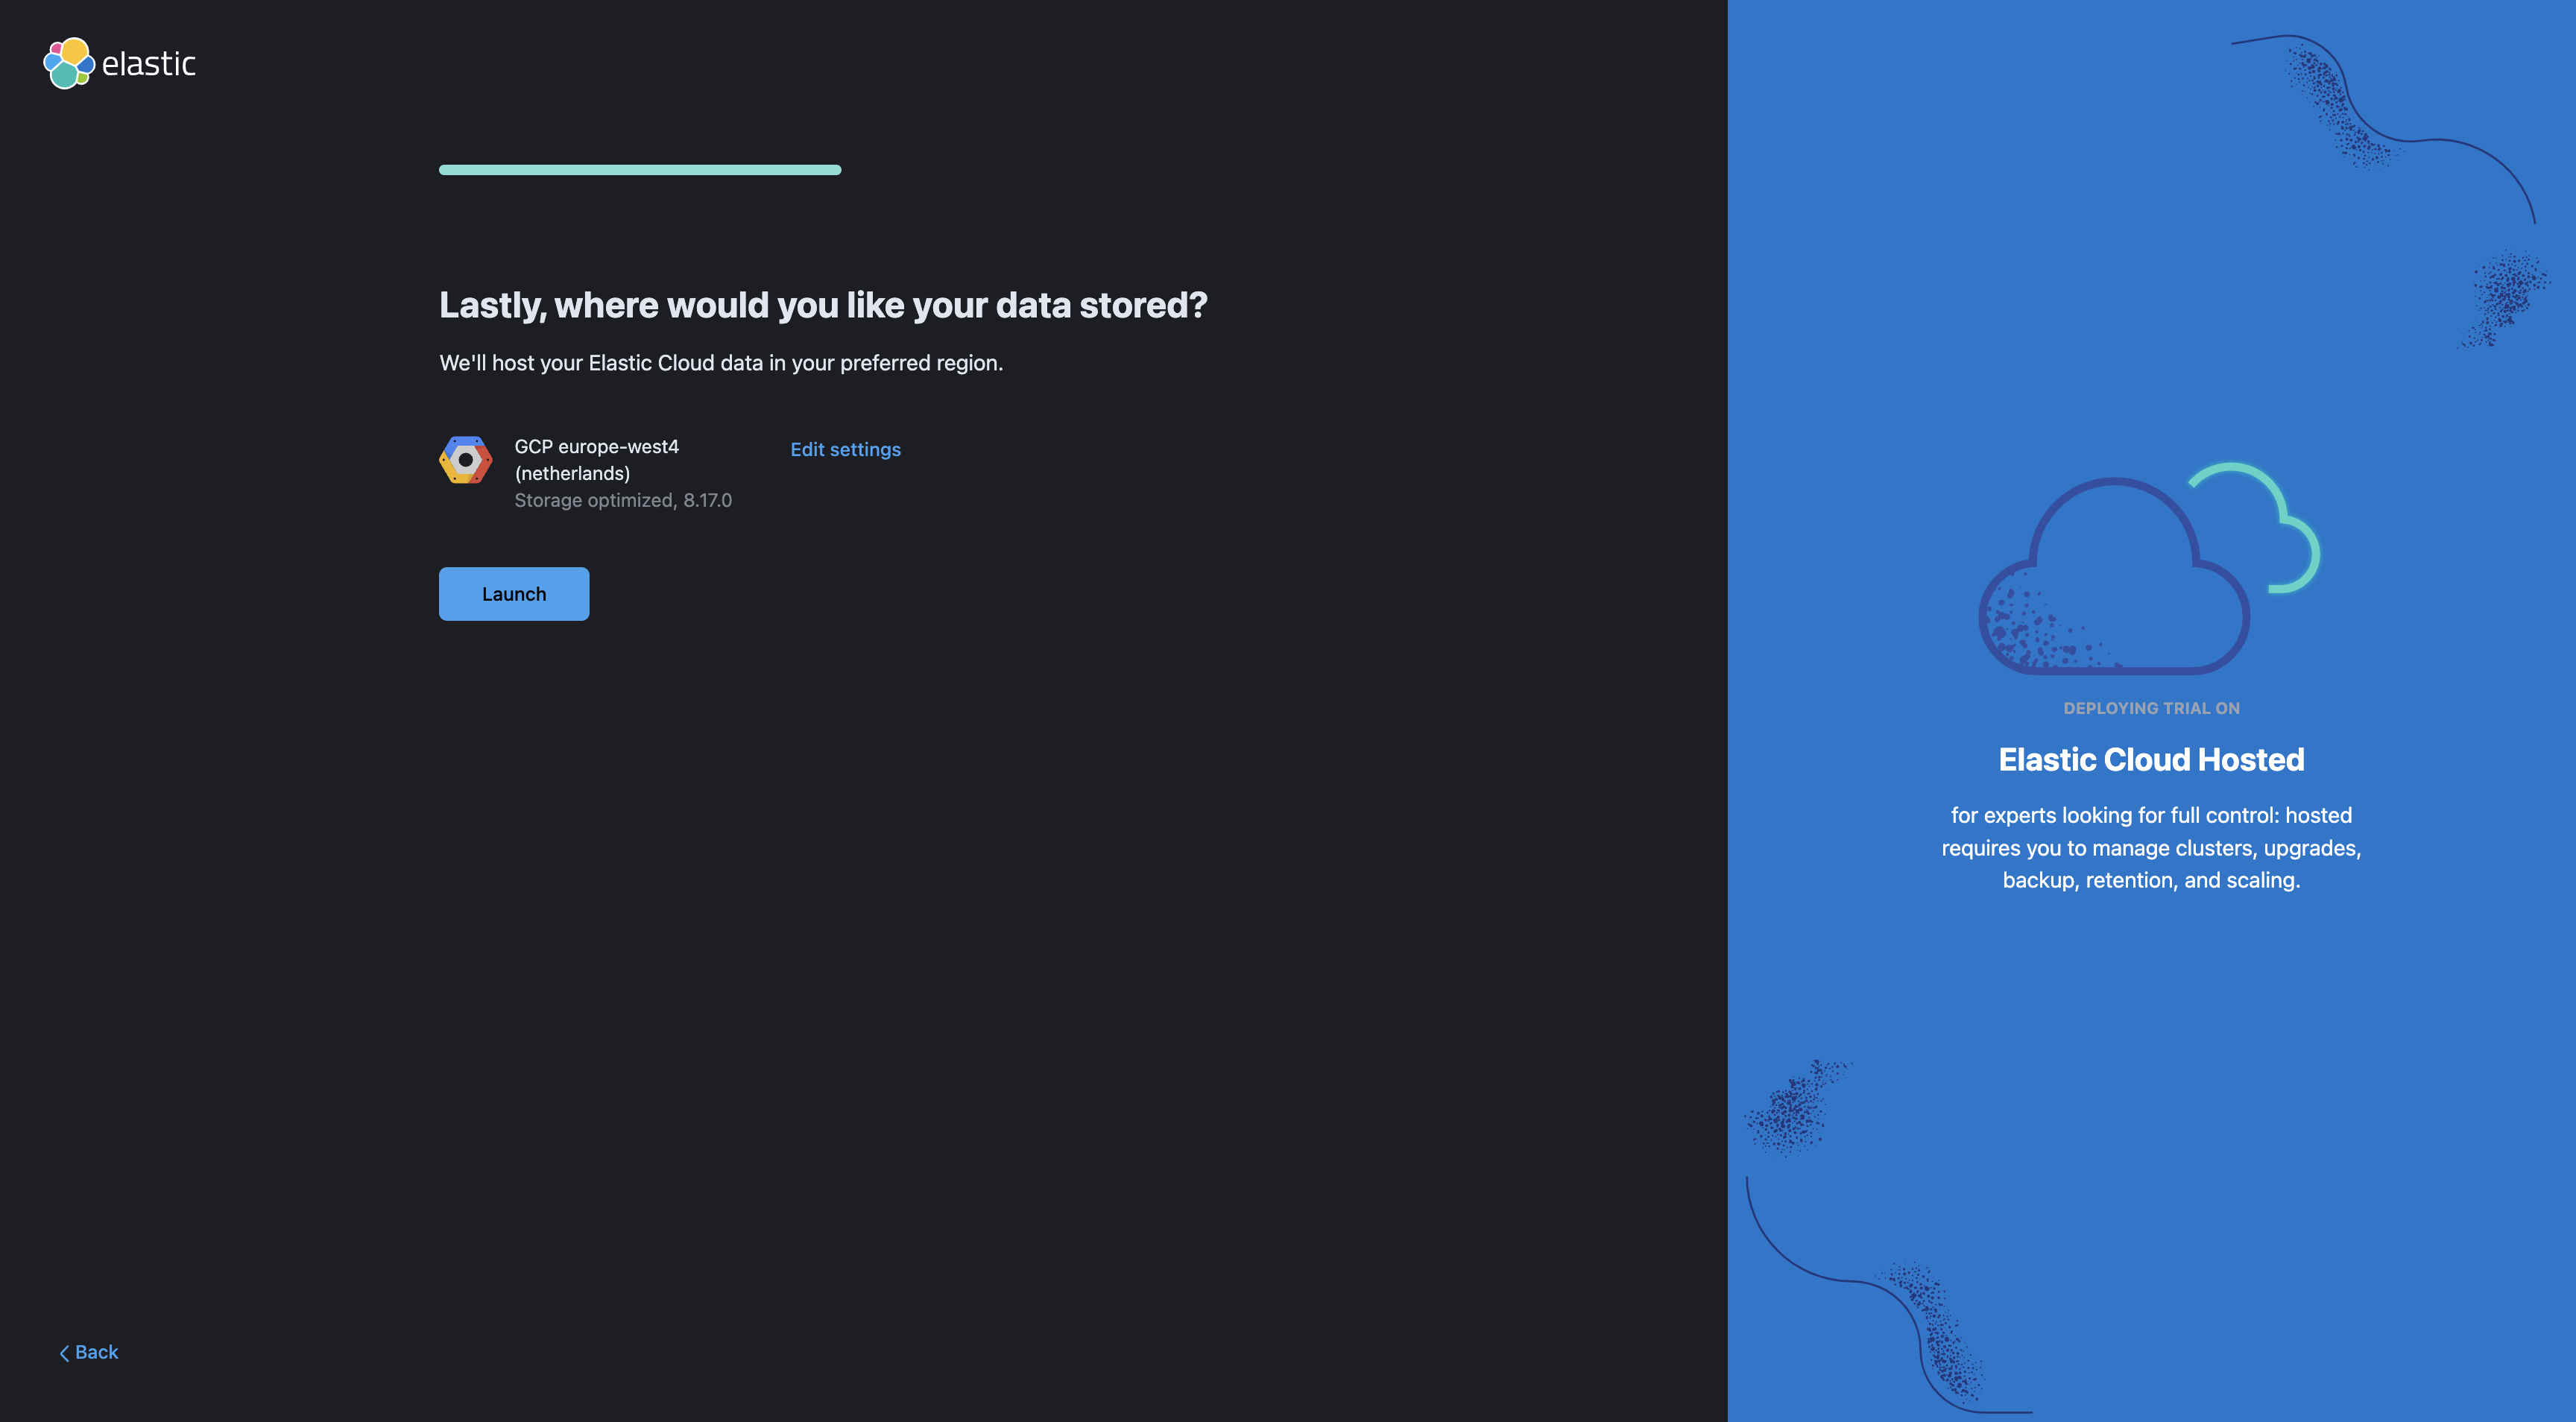
Note: make sure you use us-east1 because the rest of the lab will assume you are using that region.
Note: The deployment can take up to 5 minutes.
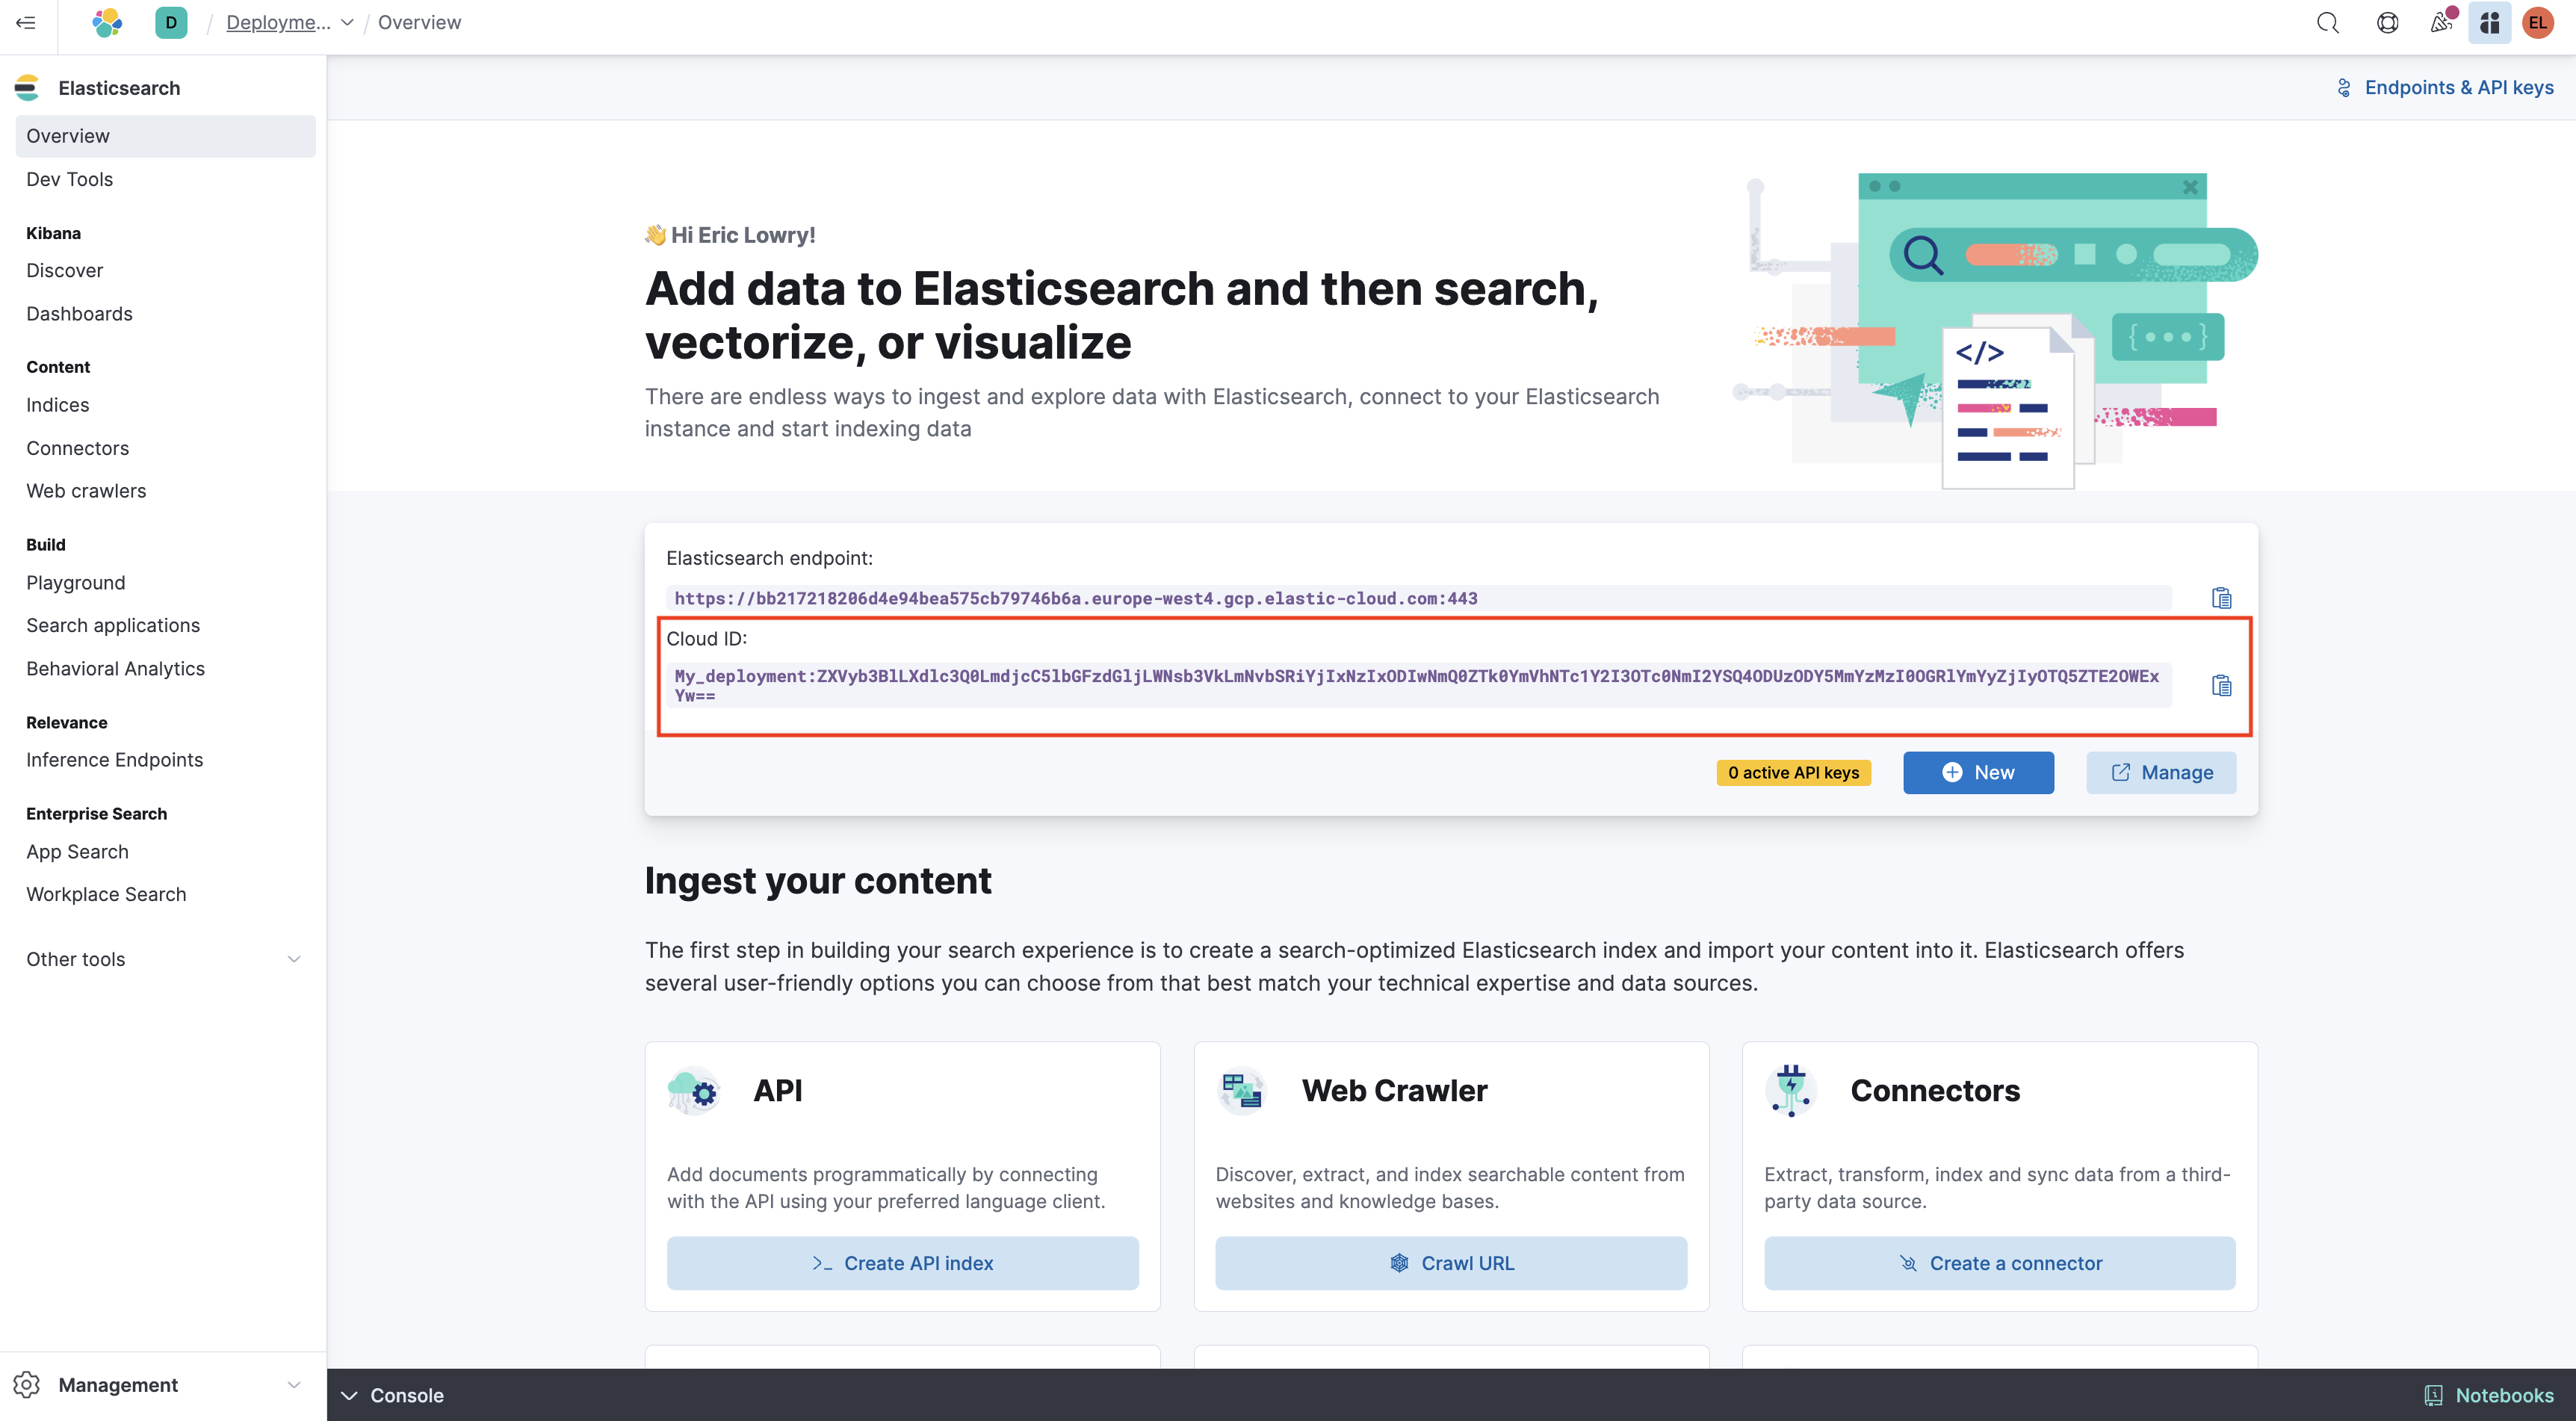
- Save your deployment credentials
Cloud ID, you will need them later when you load data from BigQuery into Elastic.
- From the bottom-right corner, click the expand arrow, select "Stack Management" and then click "View All Pages."
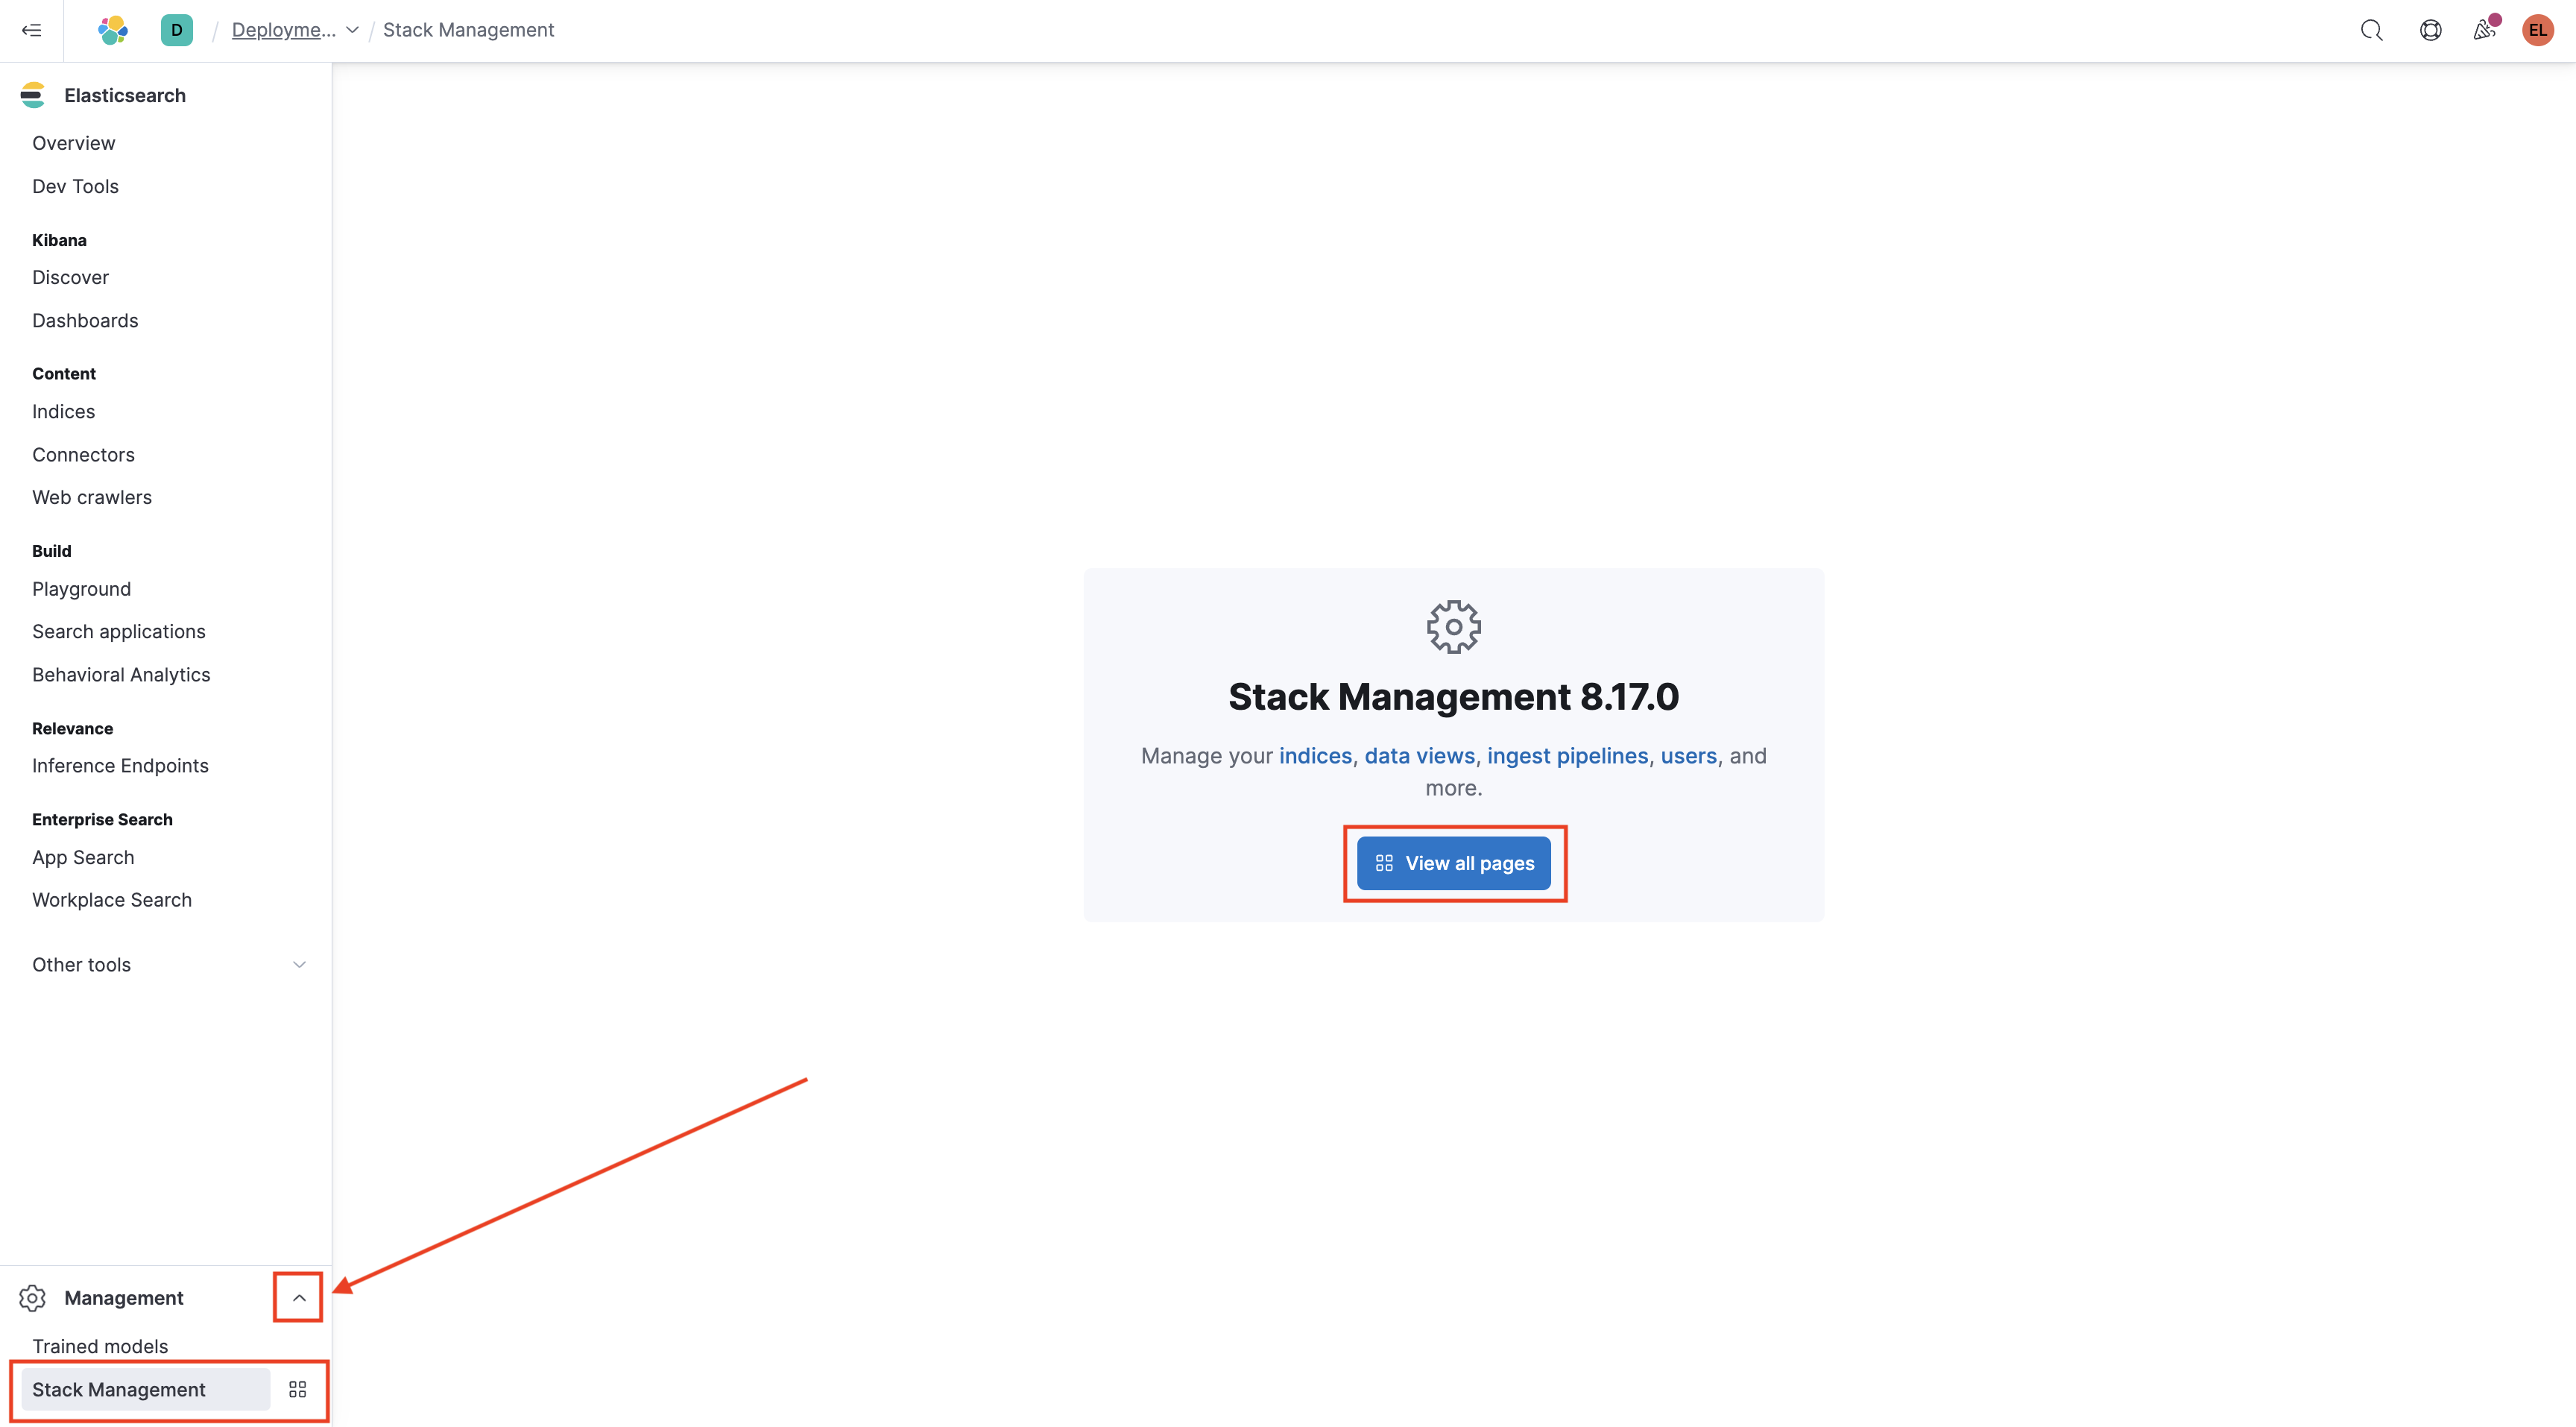
On the right side of the page under Stack Management, select "API keys".
click on Create API Key
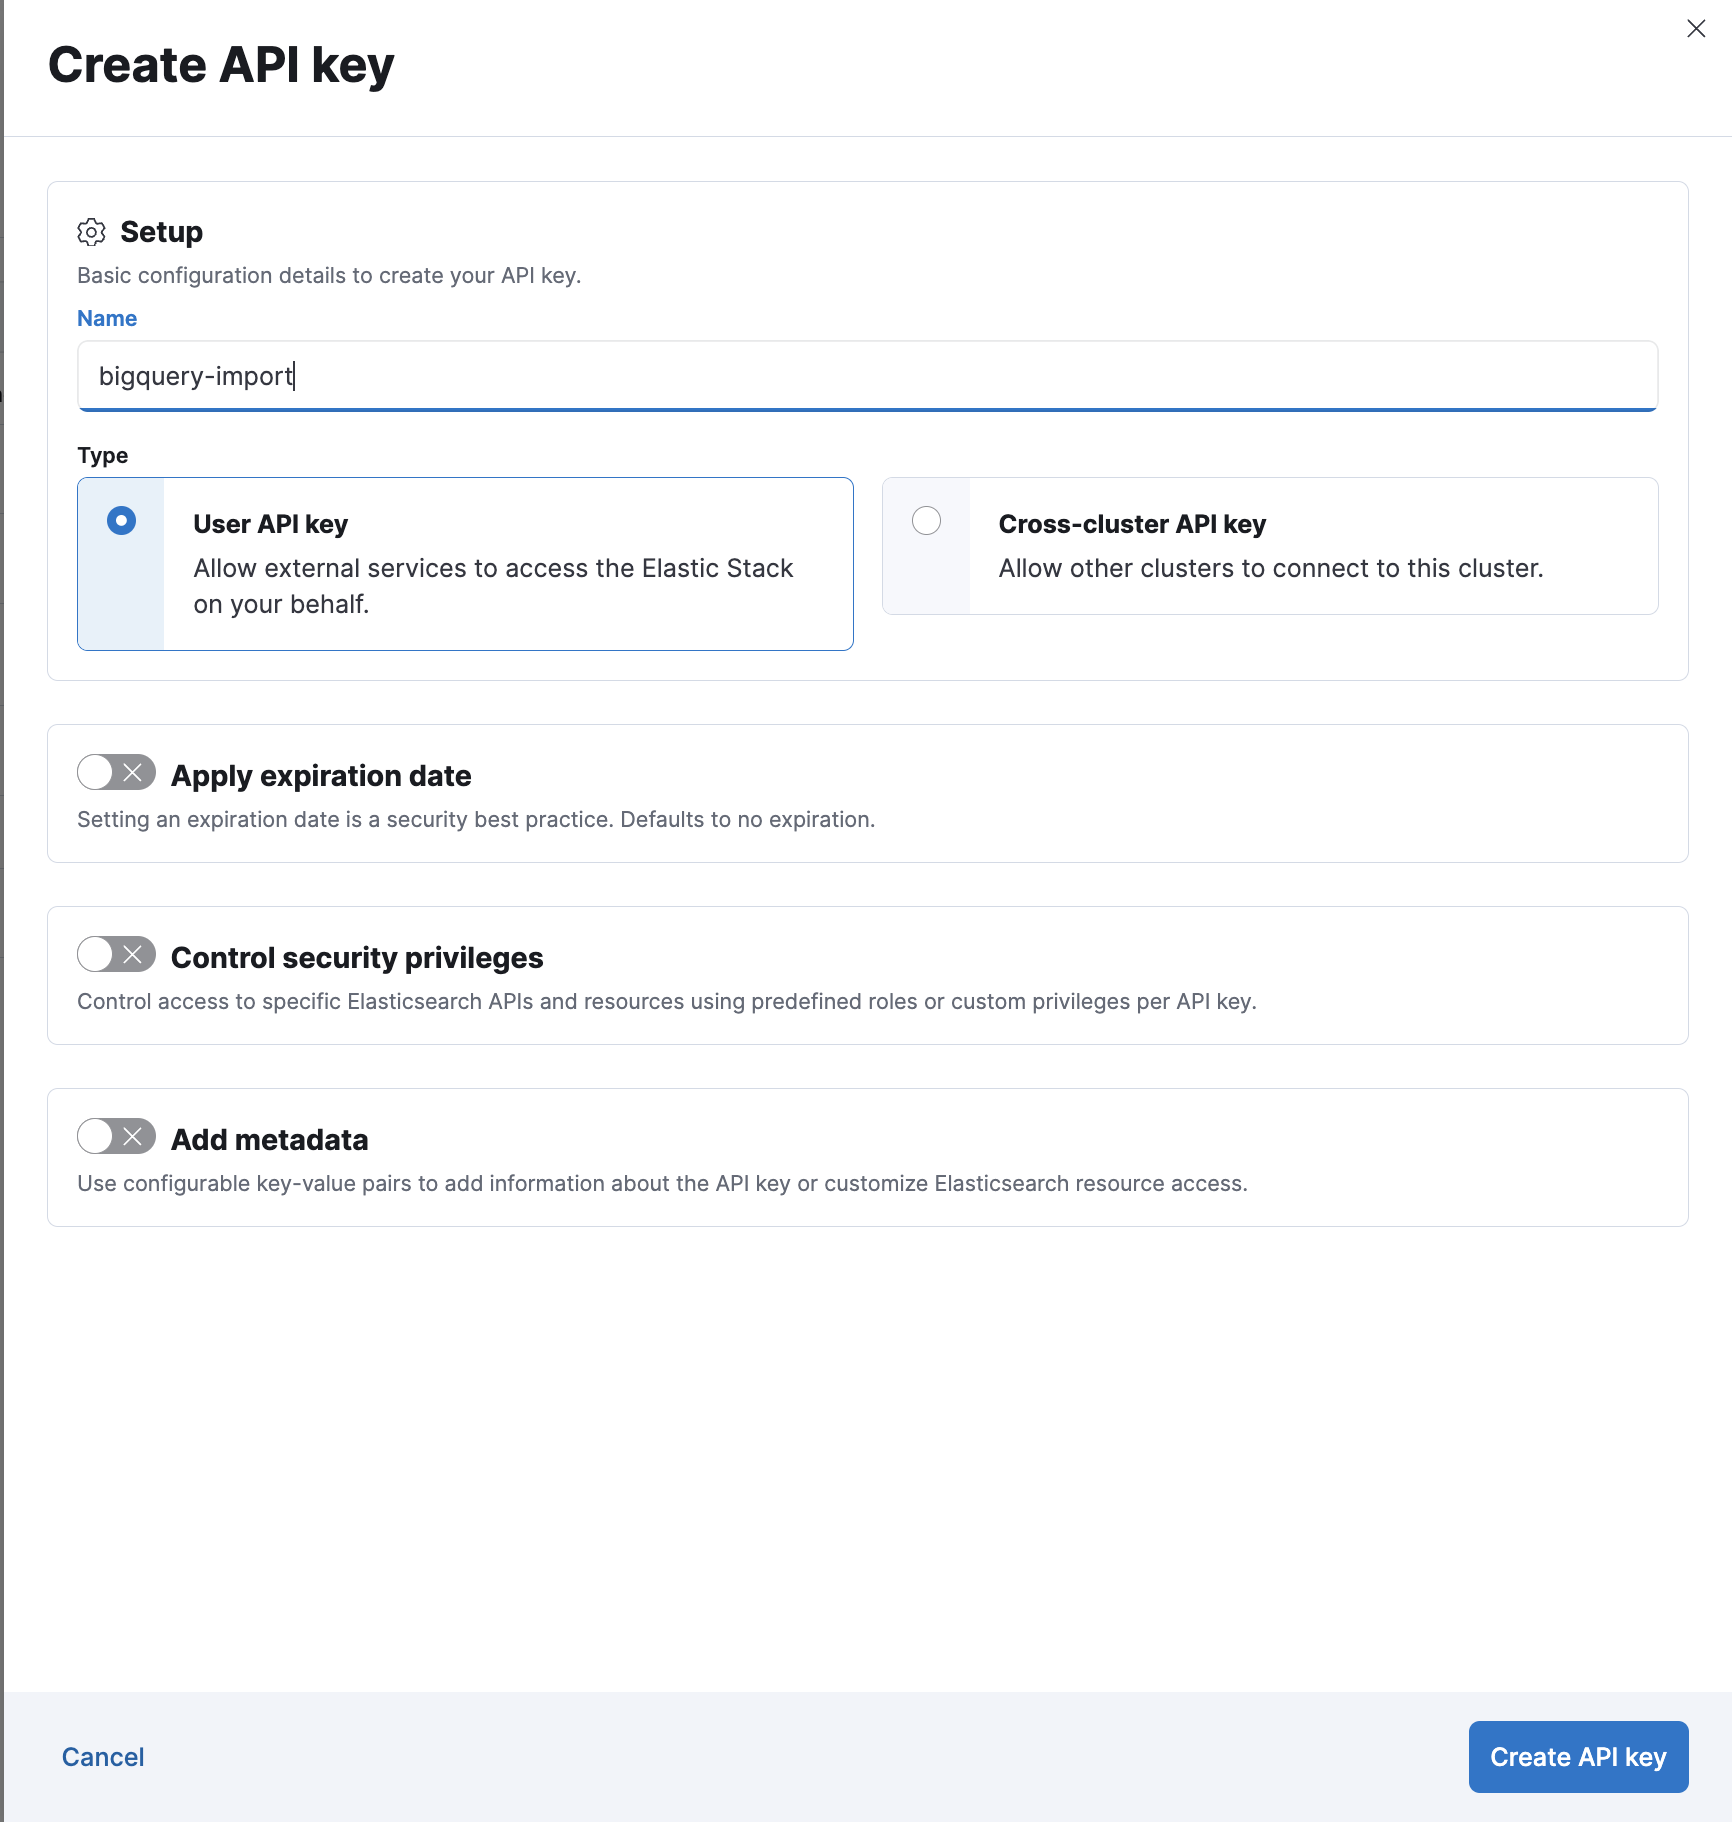
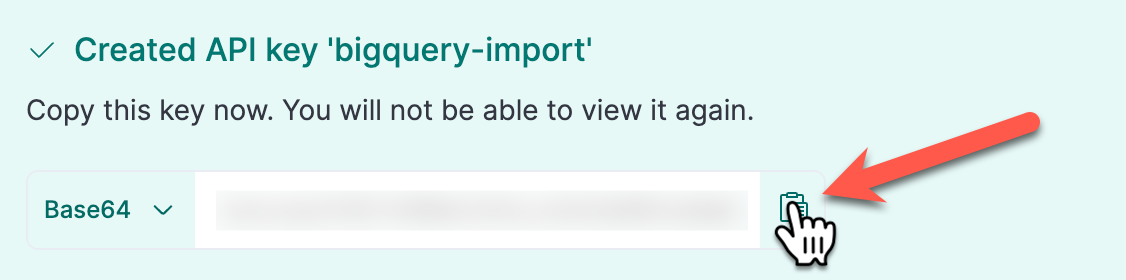
Name your key "bigquery-import" and select "Create API Key" to generate a new key
Save your new API key for later when you load data from BigQuery into Elastic..
Task 2. Create a Cloud Storage Bucket
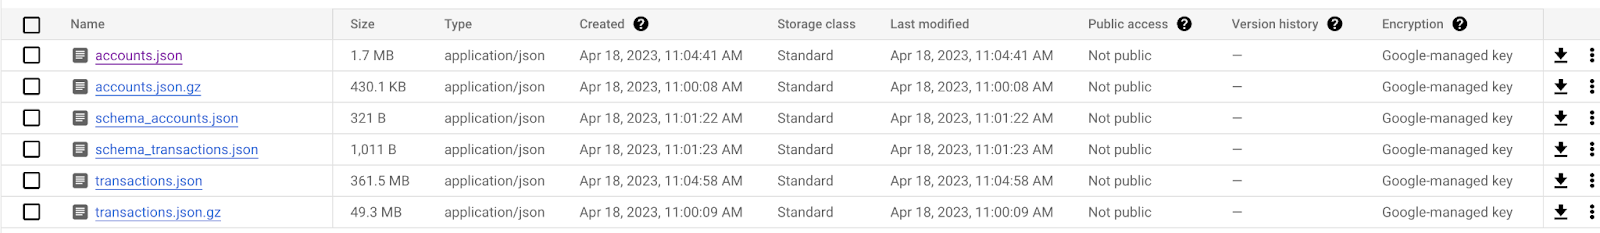
- Paste the below code into the Cloud Shell to create a new bucket and copy data from an existing bucket
export GOOGLE_CLOUD_PROJECT=qwiklabs-gcp-01-7b73175a164b
gsutil mb gs://$GOOGLE_CLOUD_PROJECT

gsutil cp -r gs://spls/gsp1153/* gs://$GOOGLE_CLOUD_PROJECT
- Go to Navigation menu > Cloud Storage > Buckets, click the name of the bucket that you created and confirm that data was copied over. This should look similar to the image below:
Click Check my progress to verify the objectives.
Create a Cloud Storage Bucket
Check my progress
Task 3. Create a BigQuery dataset and import data from Cloud Storage
- Create a BigQuery dataset by pasting the below commands into the Cloud Shell:
bq --location=us mk --dataset mainframe_import
This command creates a BigQuery dataset in the US called "mainframe_import". You should see a result that looks like this:

- Download the schemas and create two BigQuery tables in the dataset with data from Cloud Storage running the below code sequentially
gsutil cp gs://$GOOGLE_CLOUD_PROJECT/schema_*.json .
bq load --source_format=NEWLINE_DELIMITED_JSON mainframe_import.accounts gs://$GOOGLE_CLOUD_PROJECT/accounts.json schema_accounts.json
bq load --source_format=NEWLINE_DELIMITED_JSON mainframe_import.transactions gs://$GOOGLE_CLOUD_PROJECT/transactions.json schema_transactions.json
Navigate to BigQuery using the Search bar or Navigation Menu on the left hand side.
Click the drop down arrow under your project to view your dataset and table.
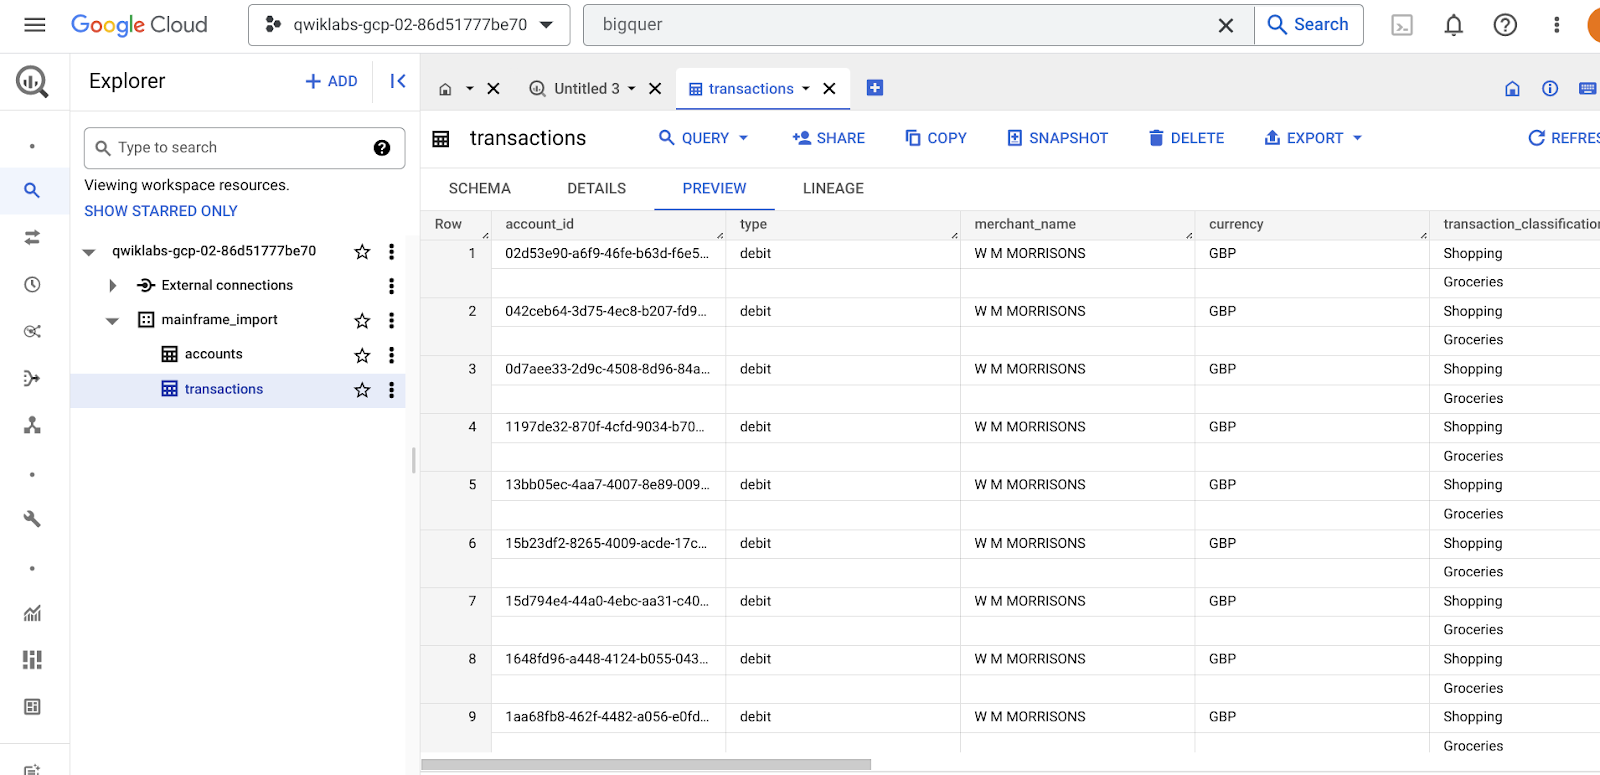
There should be two tables in your BigQuery dataset: ‘accounts' and ‘transactions'
table 1: Accounts
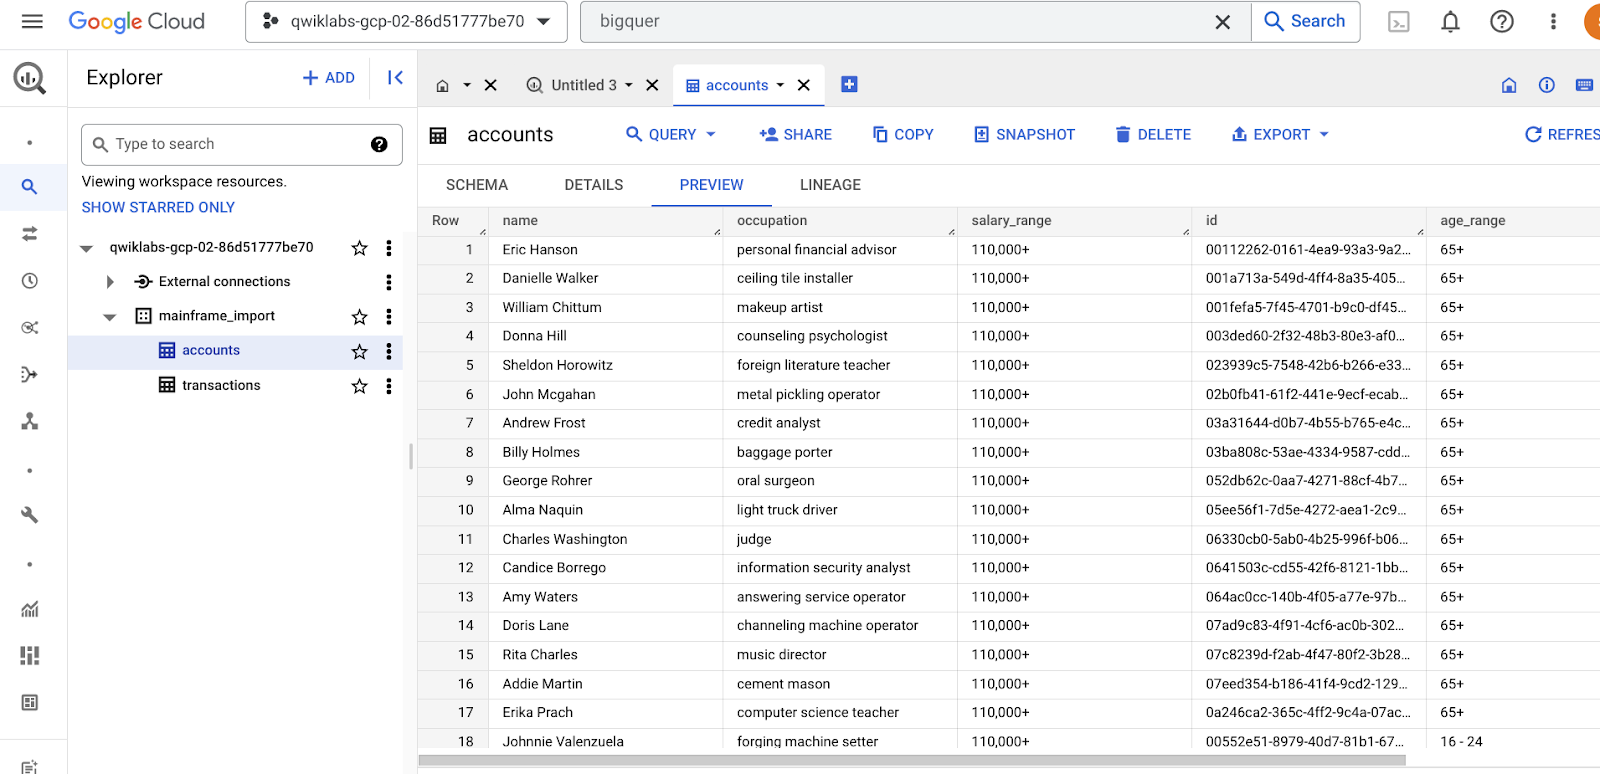
table 2: Transactions
Note: this is a small data set of simulated financial data, it doesn't represent real accounts or financial transactions.
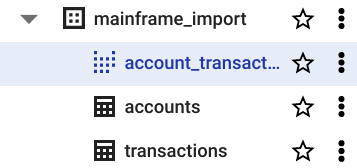
- Go to the BigQuery UI (not the Cloud Shell) and Join the tables into a BigQuery view by running the below code.
CREATE VIEW `qwiklabs-gcp-01-7b73175a164b.mainframe_import.account_transactions` AS
SELECT t.*, a.* EXCEPT (id)
FROM `qwiklabs-gcp-01-7b73175a164b.mainframe_import.accounts` AS a
JOIN `qwiklabs-gcp-01-7b73175a164b.mainframe_import.transactions` AS t
ON a.id = t.account_id;
In the BigQuery console, you should see two tables and a view:
Click Check my progress to verify the objectives.
Create a BigQuery dataset and import data from Cloud Storage
Check my progress
Task 4. Explore the mainframe data in BigQuery
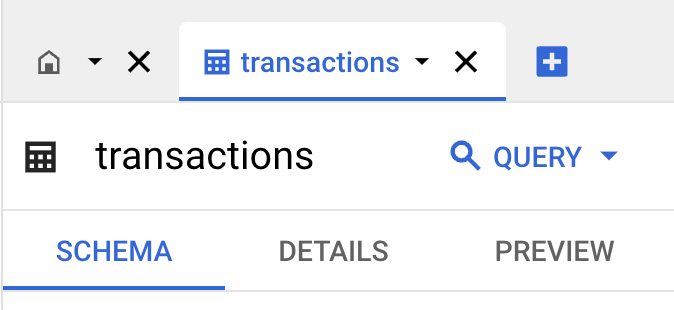
Go to BigQuery → mainframe_import → transactions
Explore the newly imported data.
If you go to "Schema" you can see the table's schema
"Details" provides metadata on the table, including creation time, data location, size (on disk) and number of rows.
"Preview" provides a snapshot of the data
- Run the below query to select the first 100 rows of data in the table
SELECT * FROM `mainframe_import.transactions` LIMIT 100
- Explore the data more by seeing how many unique occupations are in the accounts dataset. Copy the code below to count the distinct number of occupations
SELECT DISTINCT(occupation), COUNT(occupation)
FROM `mainframe_import.accounts`
GROUP BY occupation
- Explore the salary range column. Start by querying the highest salary range
SELECT * FROM `mainframe_import.accounts` WHERE salary_range = "110,000+" ORDER BY name
- One hypothesis a Data Analyst might make is that there is a correlation between salary range and age (although other factors such as Occupation will most likely influence this).
- See if you can prove or disprove this. Hint: Only select the columns you need (occupation, salary_range and age_range)
Click Check my progress to verify the objectives.
Explore the mainframe data in BigQuery
Check my progress
Task 5. Create a Dataflow job reading from BQ and pushing to Elastic
The Dataflow API should already be enabled, if not find it using the search bar
Paste the below code into the Cloud Shell to create a Dataflow job, making edits to the parts in
<< >>forCONNECTION_URLandAPI_KEY. This job will read data from your BigQuery dataset and push it to Elastic
Enter these values by hand into the cloud shell (one by one):
export CONNECTION_URL=<< your cloud ID from step 1.5 >>
export API_KEY=<< your API key from step 1.9 >>
- Now we will create a dataflow job to move the account transactions into Elastic Cloud. Cut and paste the following command into the cloud shell.
gcloud dataflow flex-template run bqtoelastic-`date +%s` --worker-machine-type=e2-standard-2 --template-file-gcs-location gs://dataflow-templates-us-east1/latest/flex/BigQuery_to_Elasticsearch --region us-east1 --num-workers 1 --parameters index=transactions,maxNumWorkers=1,query="select * from \`$GOOGLE_CLOUD_PROJECT\`.mainframe_import.account_transactions",connectionUrl=$CONNECTION_URL,apiKey=$API_KEY
This should generate a message similar to the one below
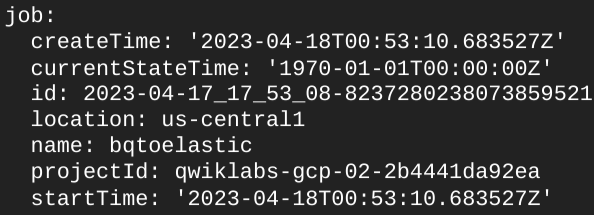
- Go to Dataflow → Jobs to make sure you job is running
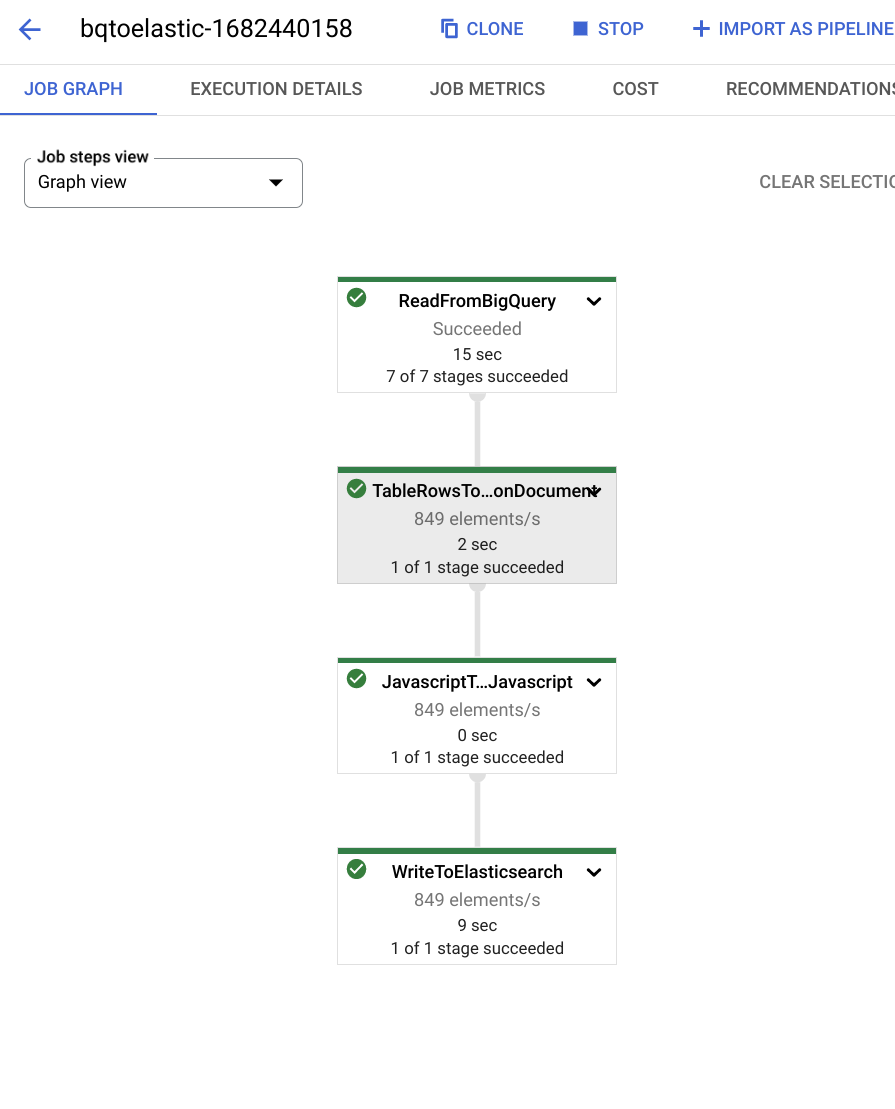
Note: If the Dataflow job fails, rerun the job.
Click Check my progress to verify the objectives.
Create a Dataflow job reading from BQ and pushing to Elastic
Check my progress
Task 6. Explore the data in Elastic
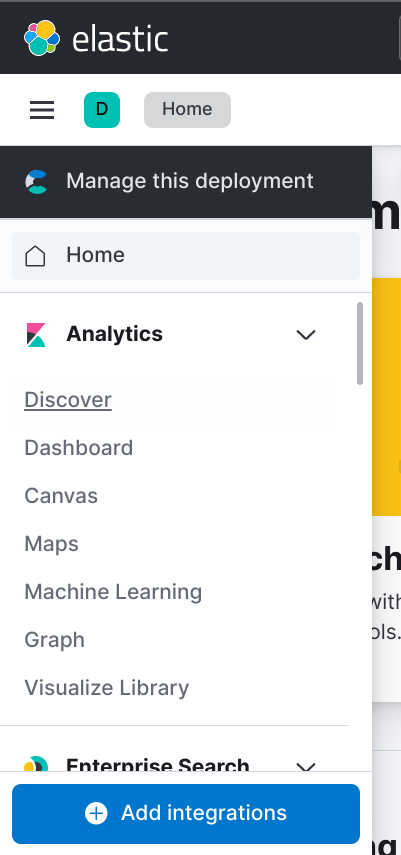
Go back to the Elastic Cloud
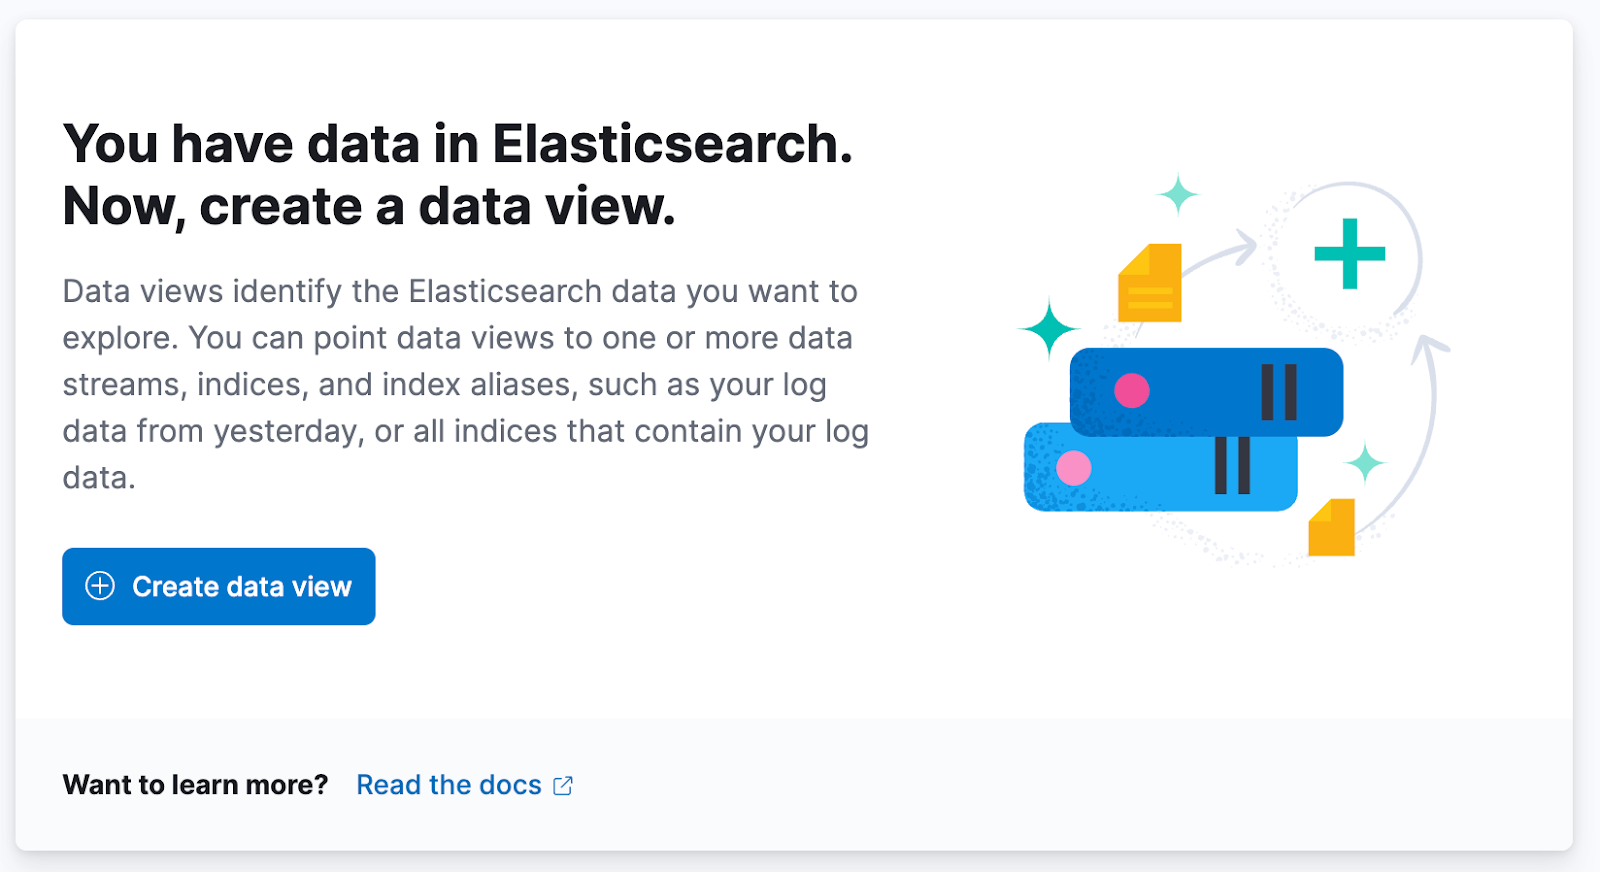
Go to Discover
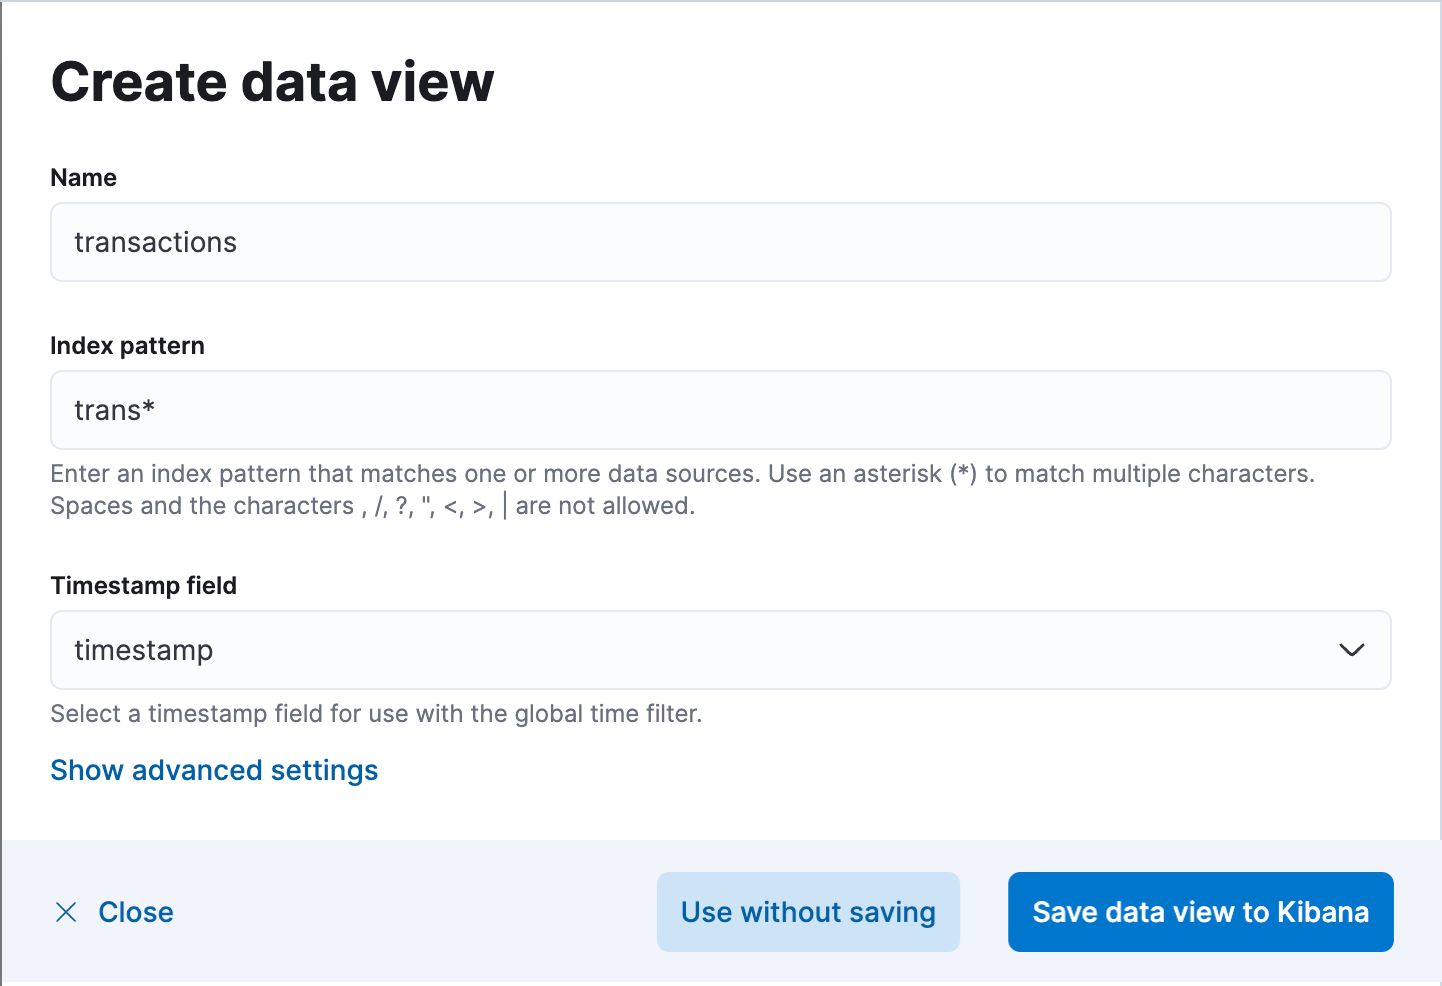
- Click ‘Create a data view'
- Include the Name, Index pattern and select timestamp from the Timestamp field dropdown. Then click "Save data view to Kibana"
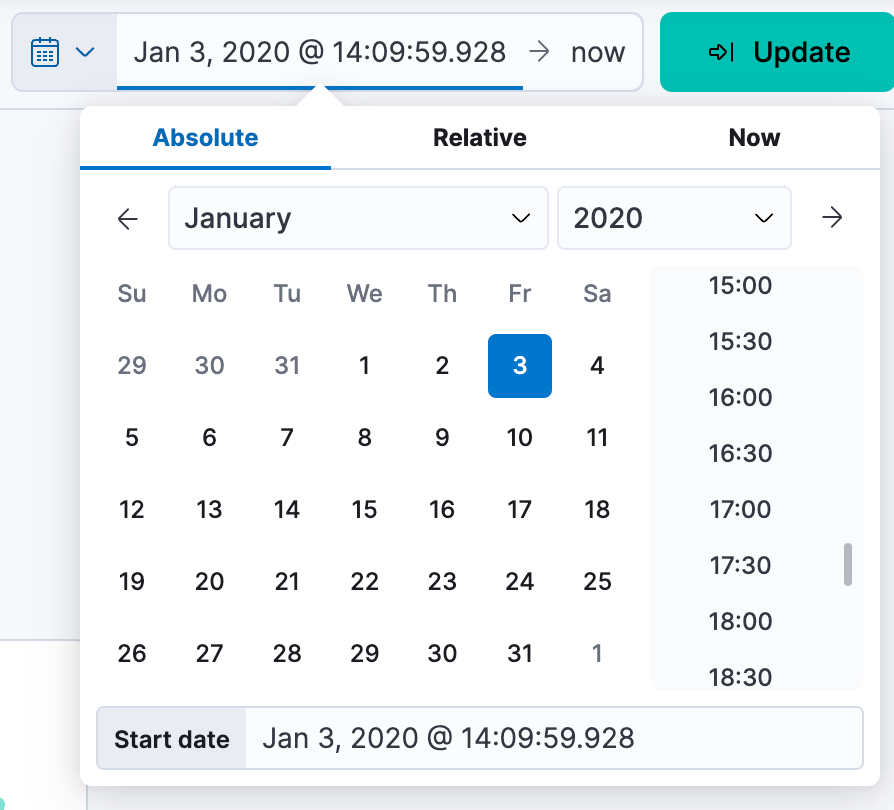
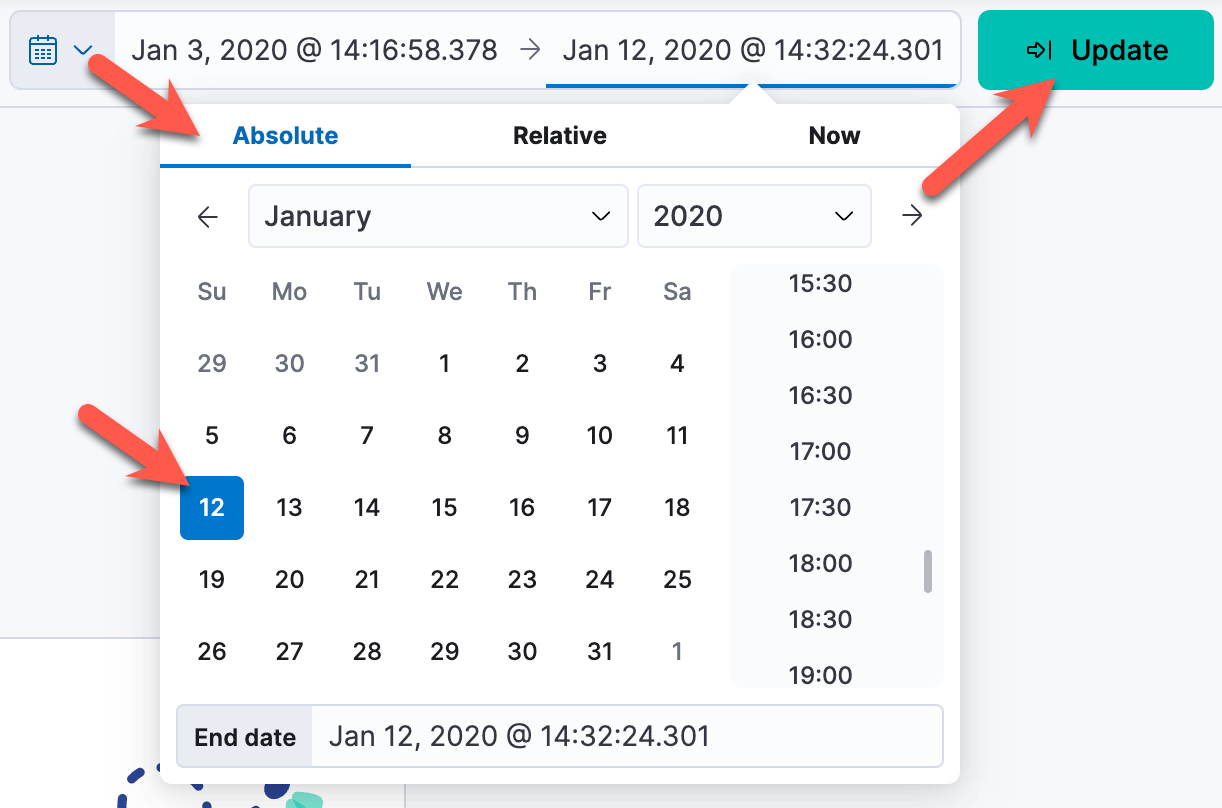
- To view the sample dataset, set the date range from Jan 3, 2020 to Jan 12, 2020
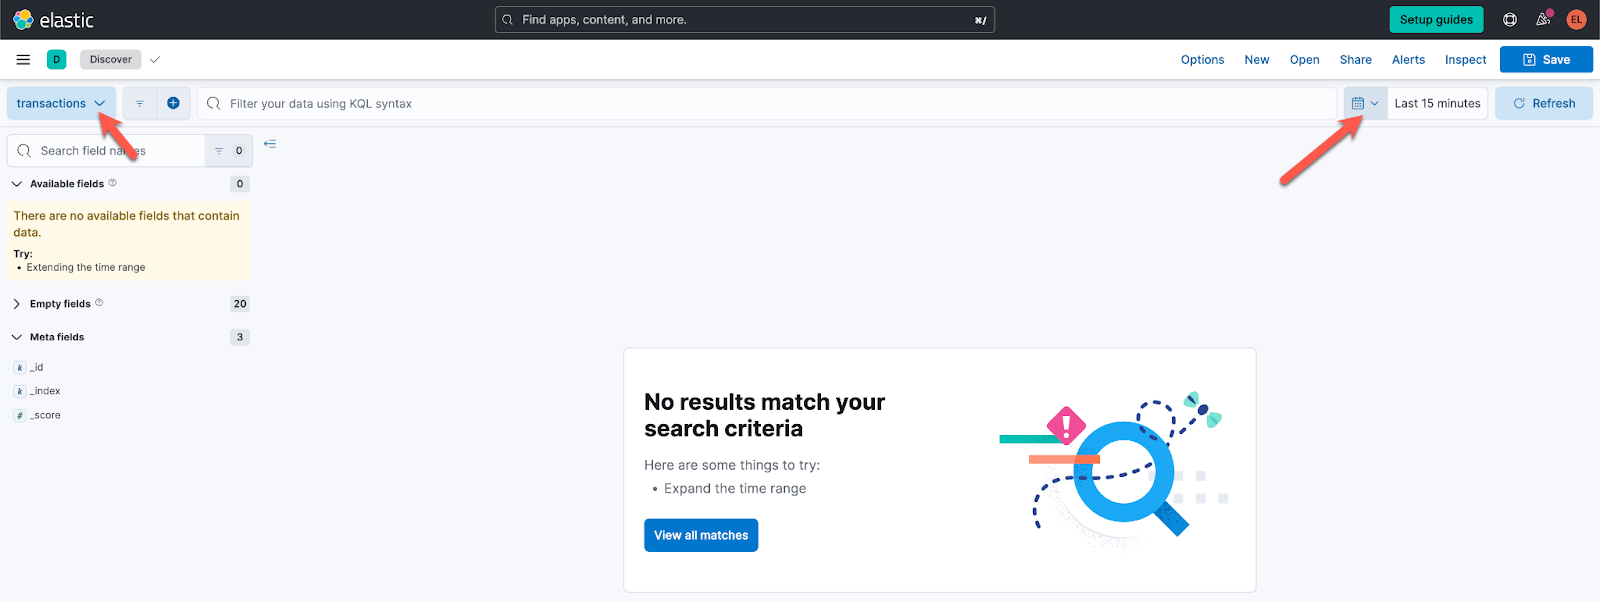
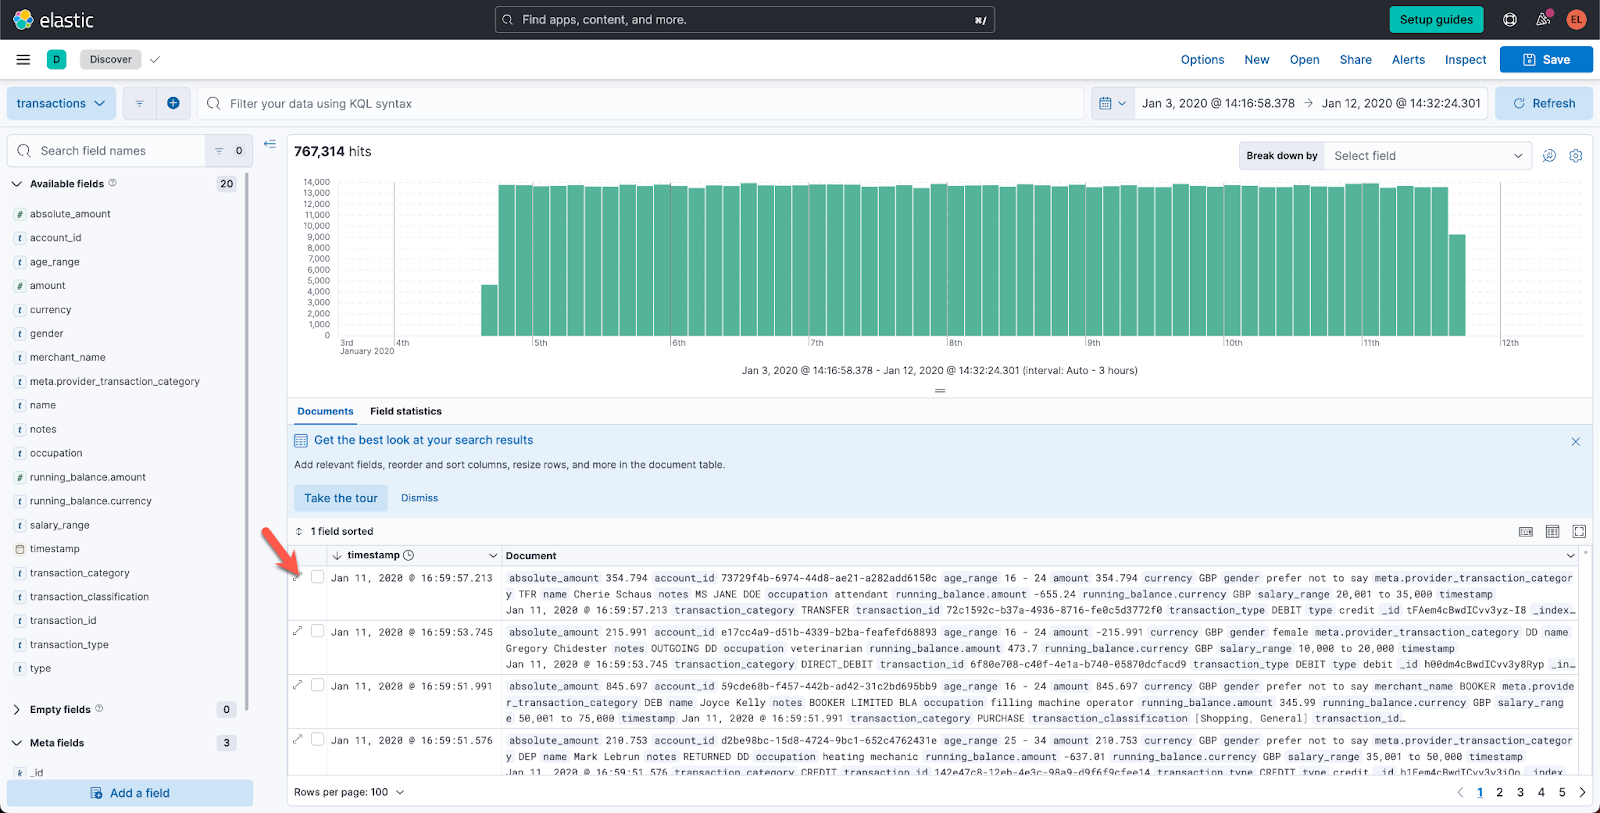
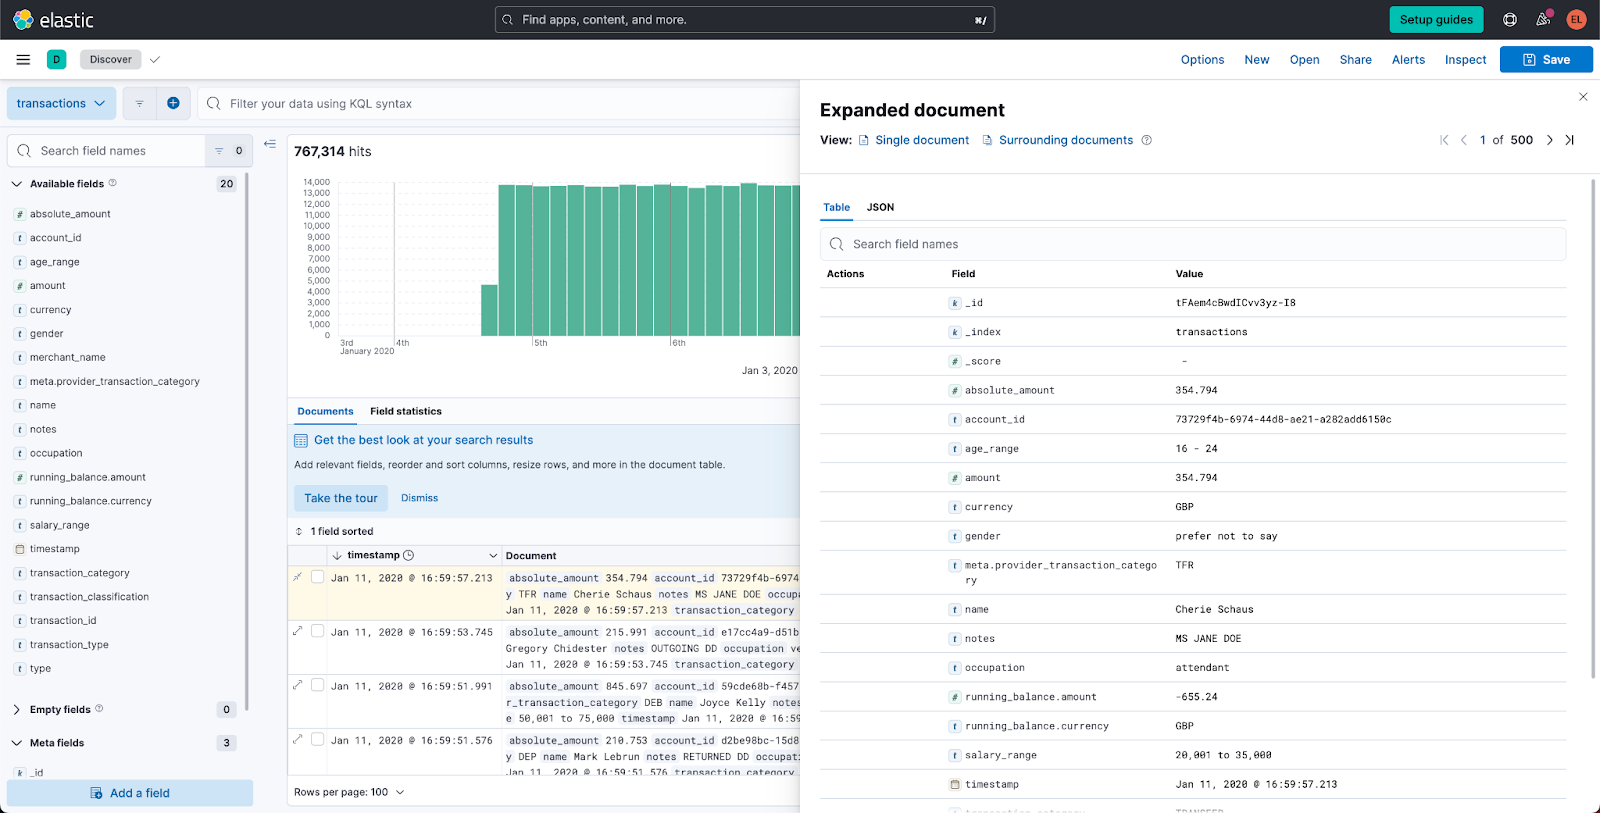
- Expand one of the transactions to see the fields you have to work with
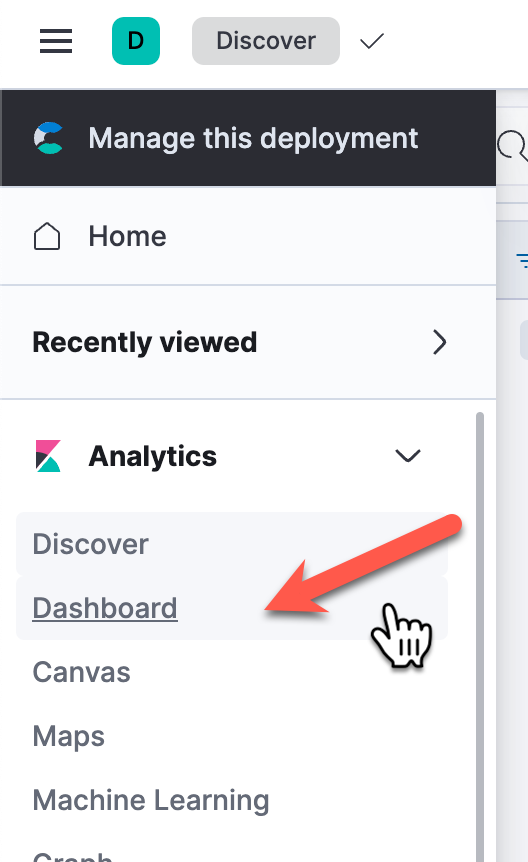
Task 7. Create a simple dashboard
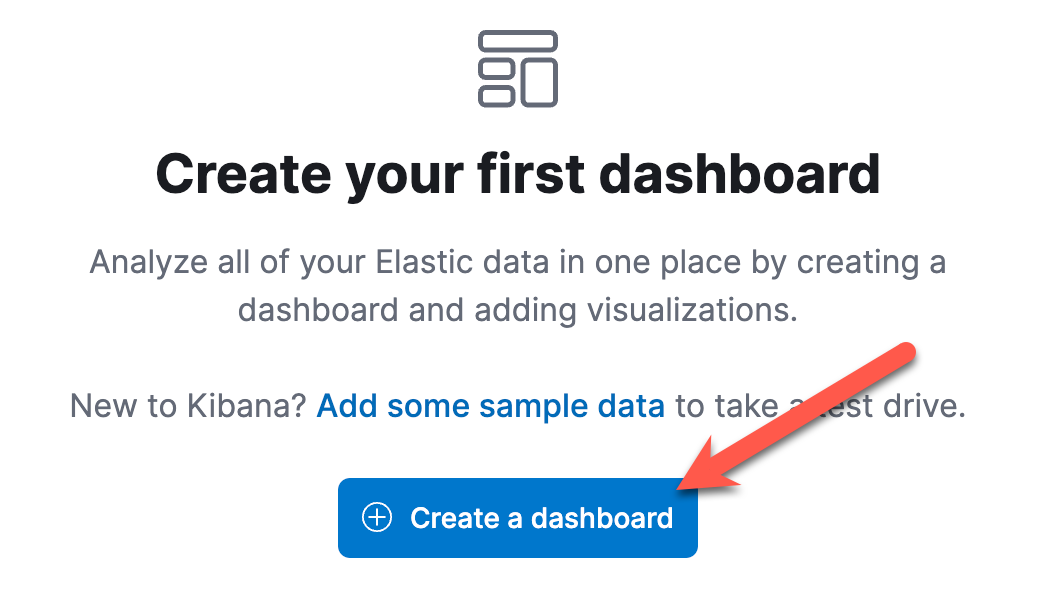
- Select the Analytics "Dashboard" from the left Menu and then select "Create a dashboard"
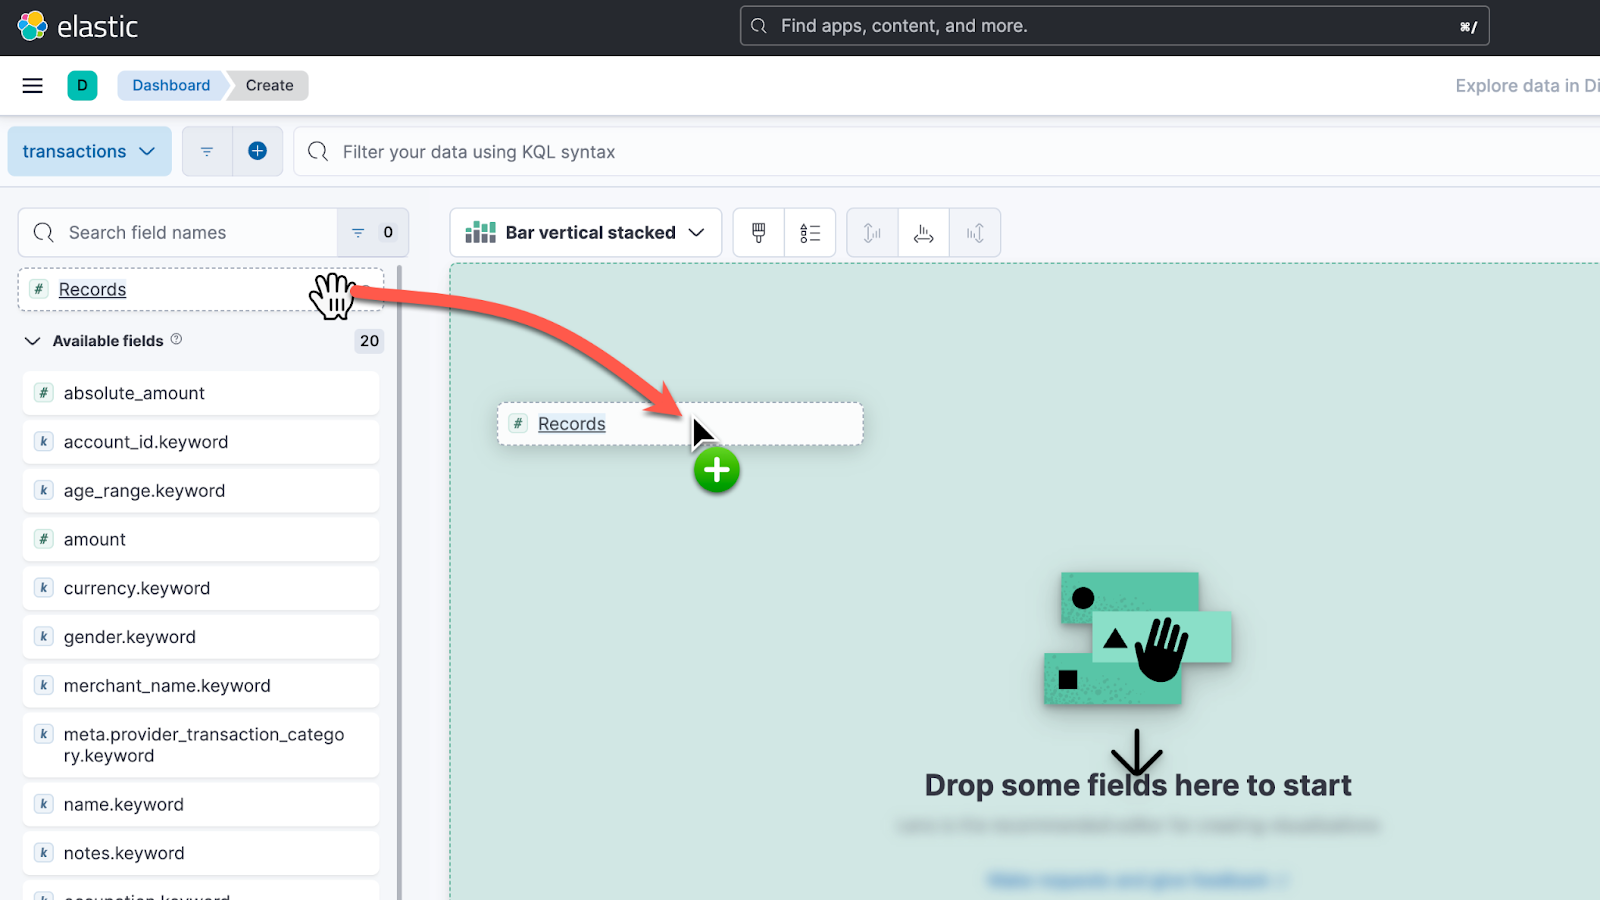
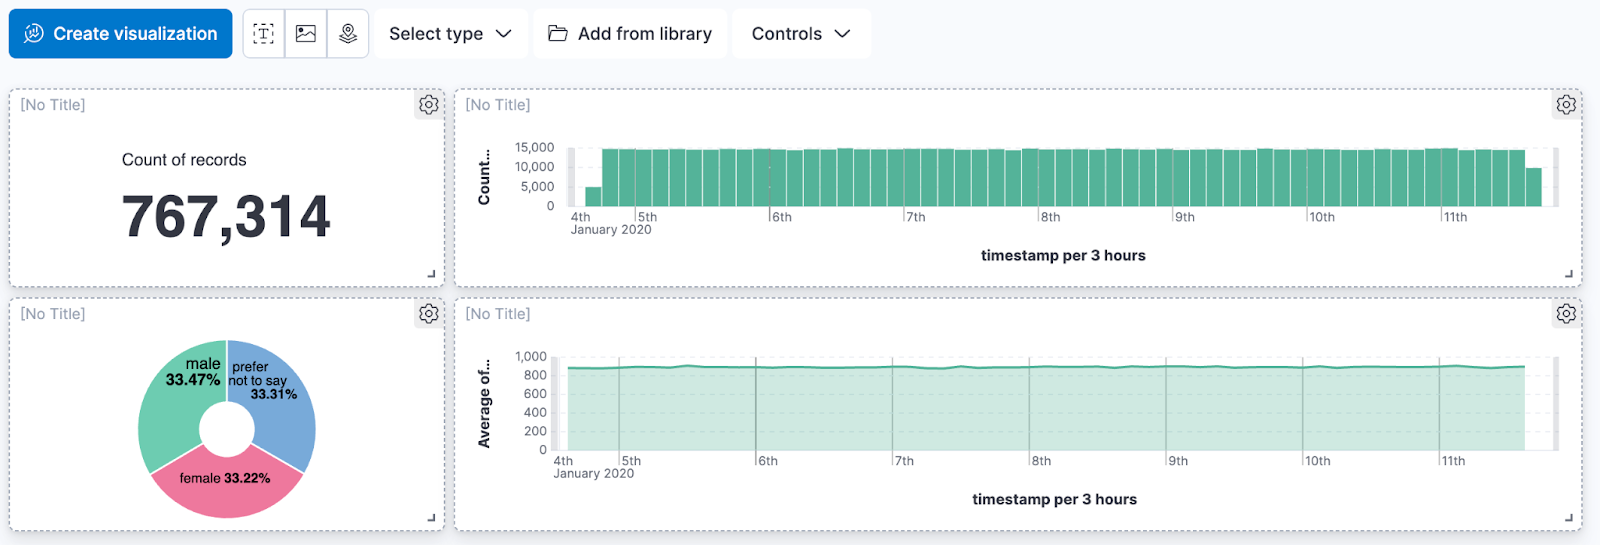
- Click "Create visualization" and then drag and drop the field "Records" onto the visualization canvas
- Click "Save and Return" to save the visualization and return to the dashboard. Grab the lower right corner of the visualization and resize it to look something like this
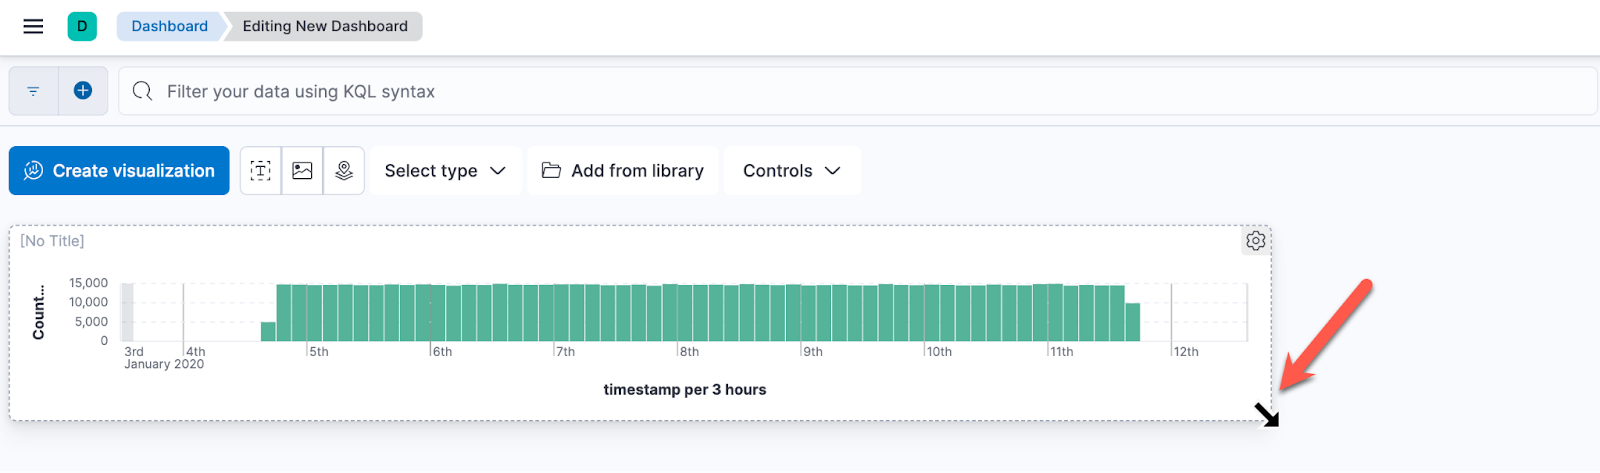
This bar chart displays the number of transactions that occurred over the time frame. It will also make it easy for the user to zoom into a specific day or hour that they are interested in.
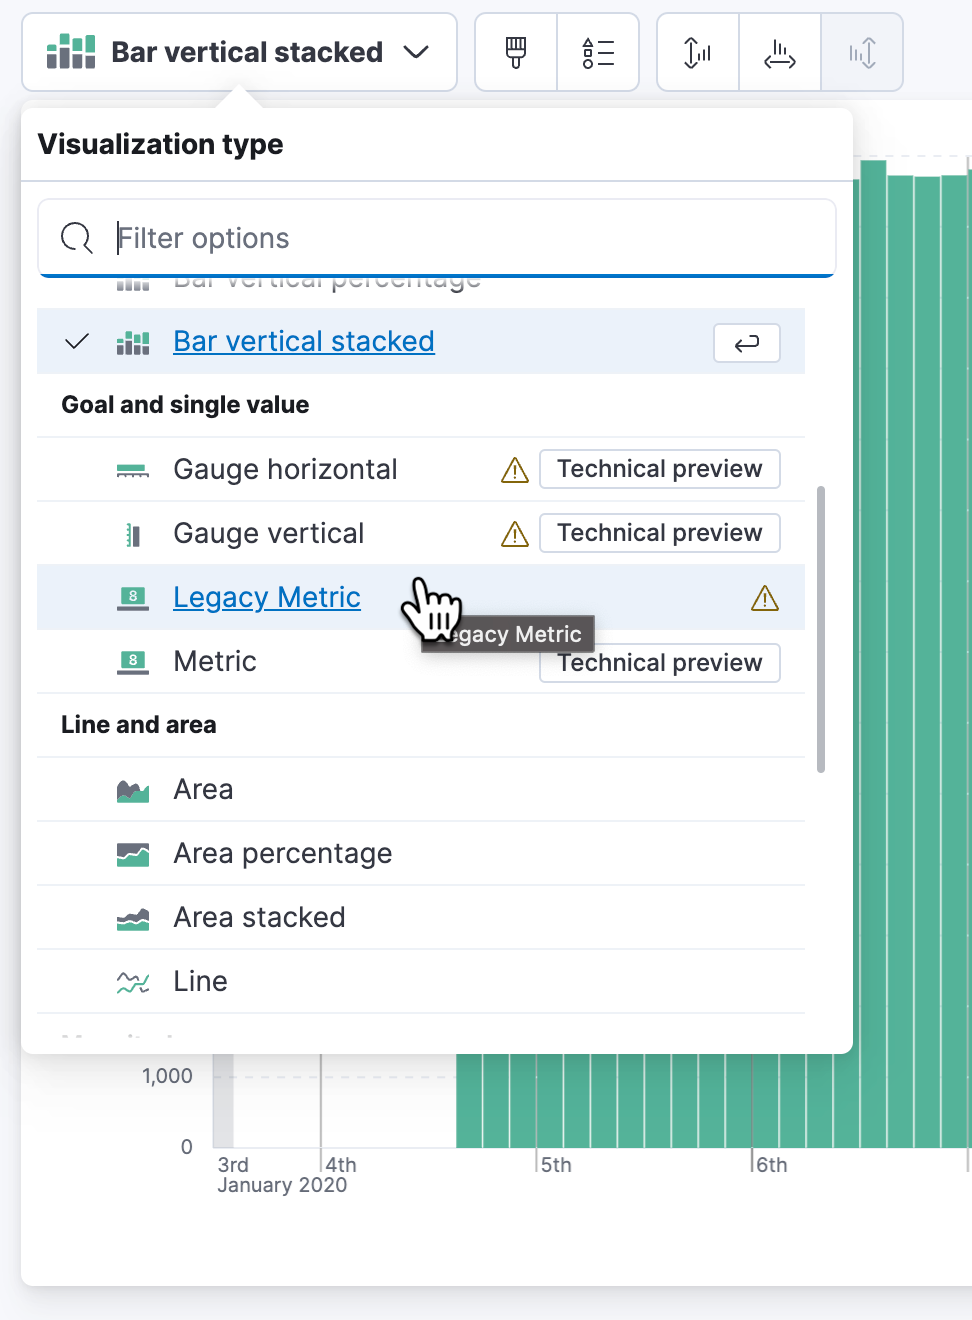
- Click "Create visualization" to add another visualization to the dashboard, again drag and drop the field "Records" onto the canvas. Change the visualization type to "Legacy Metric". Click "Save and return" to save the visualization and return to the Dashboard.
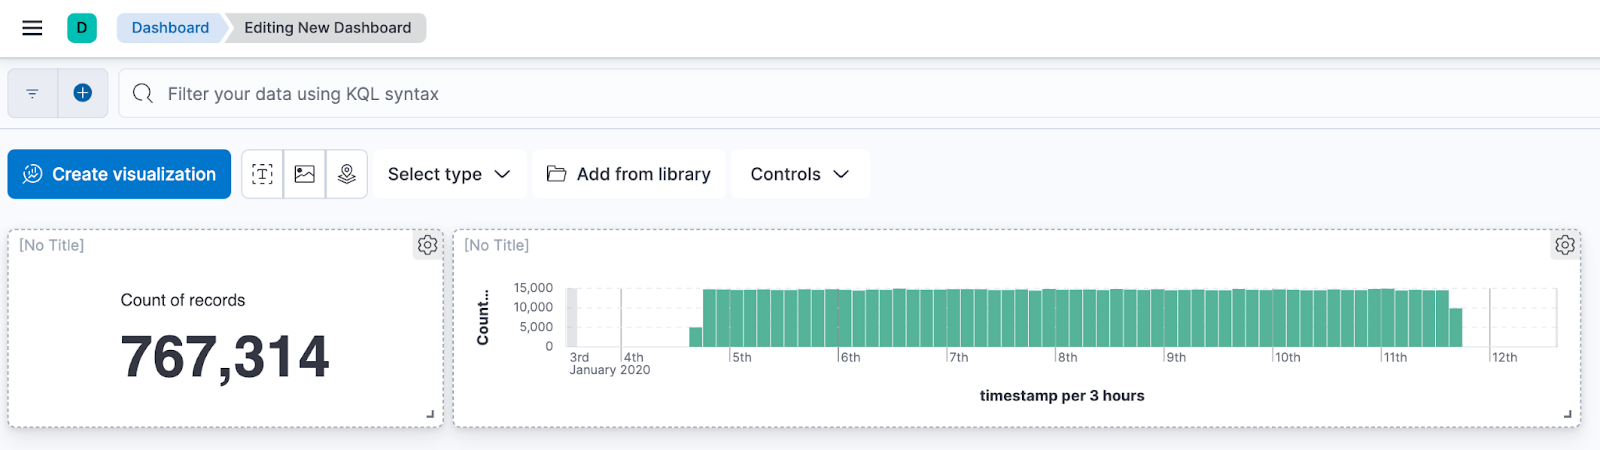
- Resize and rearrange to visualizations to look something like this:
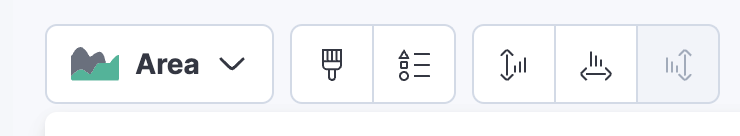
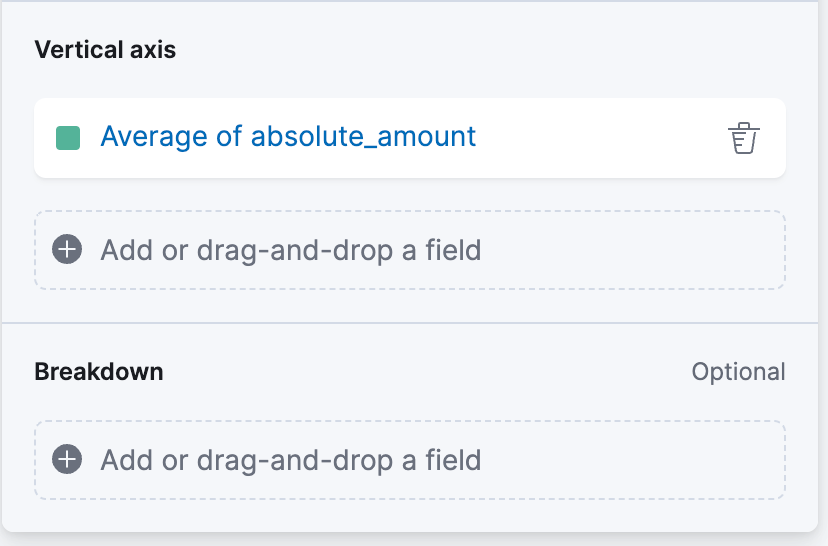
- Click "Create visualization" and drag and drop the file "absolute_amount" onto the canvas. Change the visualization type to "Area" and set the vertical Axis to "Average". Click "Save and return"
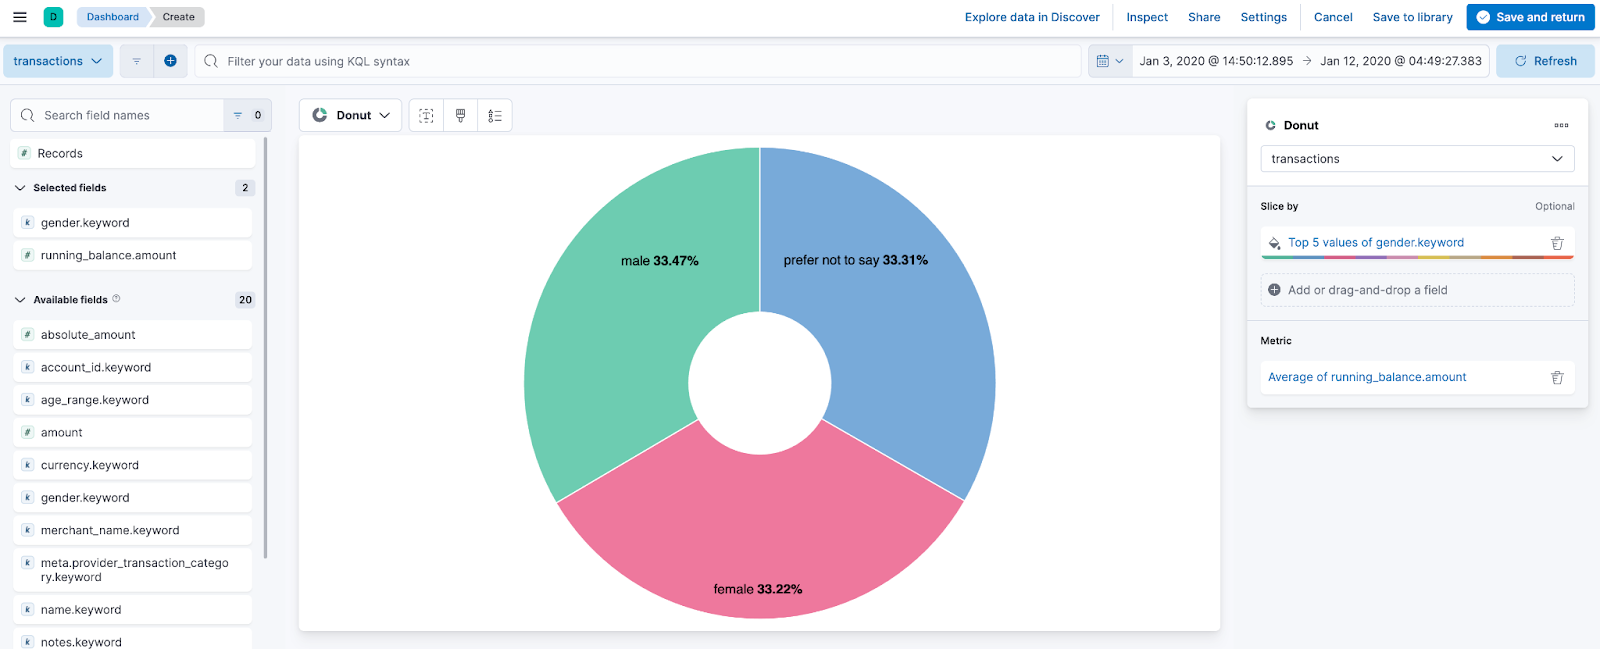
Click "Create visualization" and select the Pie visualization type then click on paint brush
. symbol which will open up the Appearance menu. Under Donut hole, select small and Drag the field "gender.keyword" onto the "Slice by" field, and drag the "running_balance.amount" field onto the metric field. Change the metric function from Median to Average. Click "Save and return"

- Resize and rearrange the visualizations to look something like this
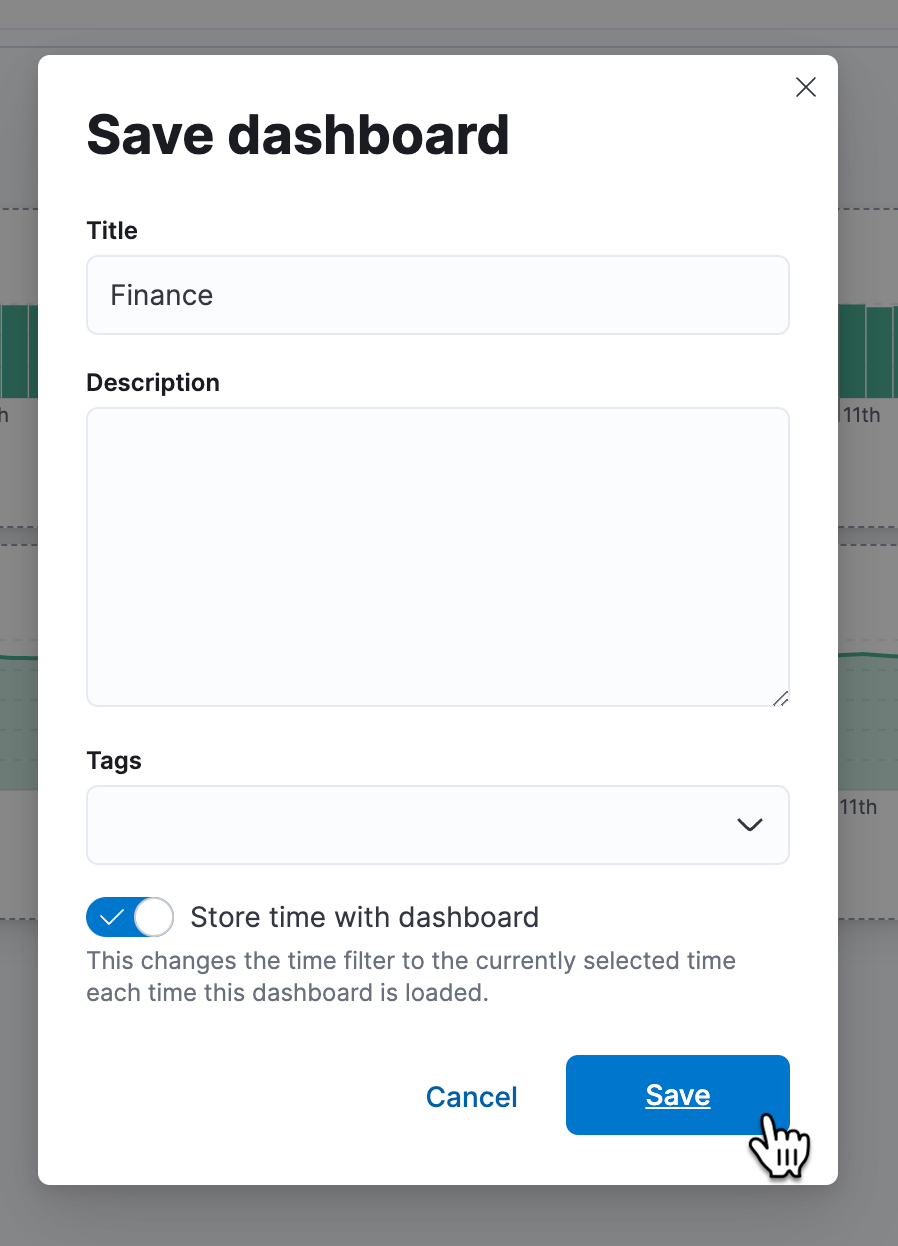
- Click "Save" and enter a title for your Dashboard, check "Store time with dashboard" to set the current time range whenever you load the dashboard in the future. Click "Save" to finish saving your dashboard.
Congratulations, you have created your first dashboard.
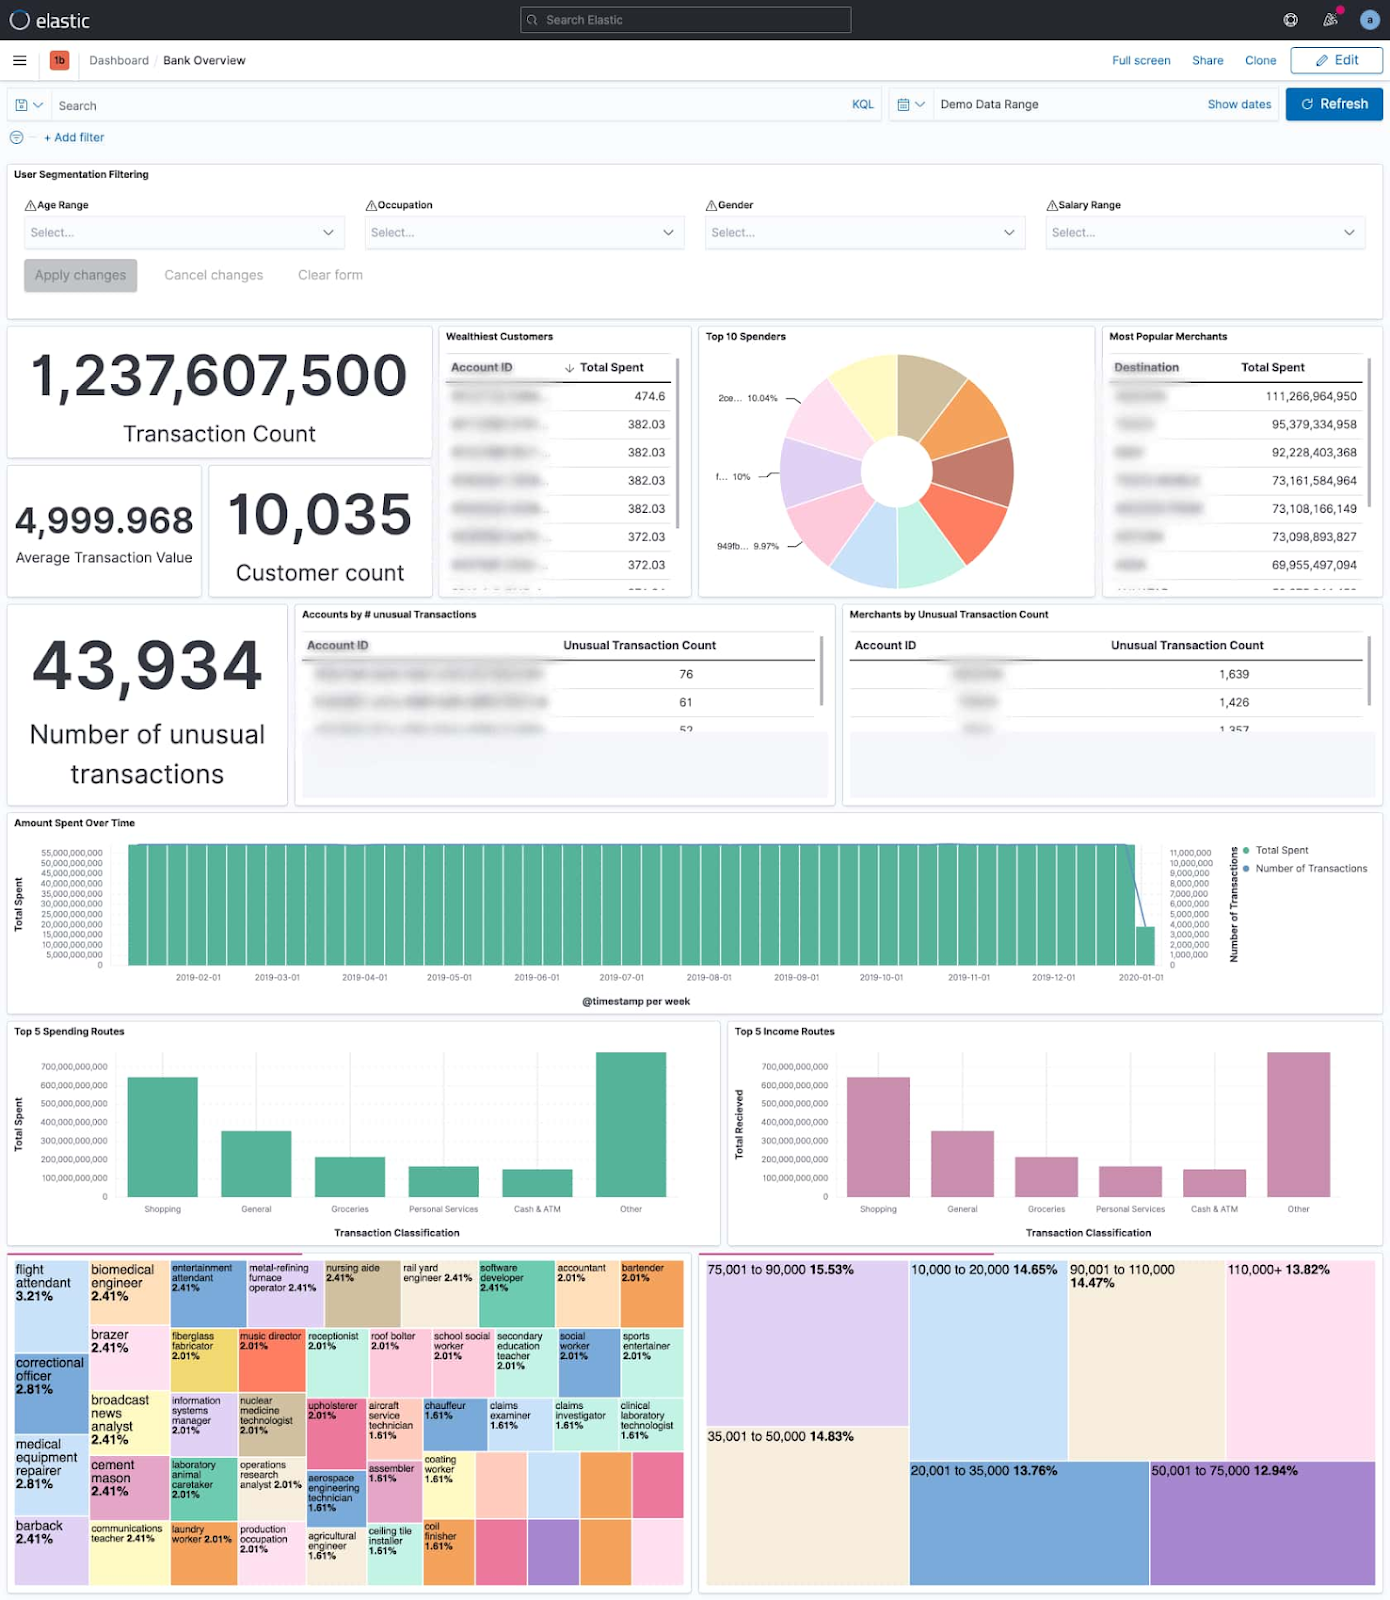
See if you can create some of these visualizations from the data:
- Create three of the below visualizations in the dashboard, ‘Transaction Count’, ‘Customer Count’ and ‘Top 10 Spenders pie chart’
Solution of Lab
curl -LO raw.githubusercontent.com/Techcps/Google-Cloud-Skills-Boost/master/Offloading%20Financial%20Mainframe%20Data%20into%20BigQuery%20and%20Elastic%20Search/techcps1153.sh
sudo chmod +x techcps1153.sh
./techcps1153.sh