Sending and Scheduling Dashboards in Looker - GSP1162
A passionate full-stack developer from @ePlus.DEV
Overview
Looker is a modern data platform in Google Cloud that lets you analyze and visualize your data interactively. You can use Looker to do in-depth data analysis, integrate insights across different data sources, build actionable data-driven workflows, and create custom data applications.
In this lab, you will learn the difference between sending and scheduling in Looker and how to send and schedule dashboards.
Objectives
In this lab, you will learn how to perform the following tasks:
Create a new visualization from the Explore and save to a new dashboard
Prepare the dashboard for one-time distribution
Schedule the dashboard for regular distribution
Setup and requirements
Before you click the Start Lab button
Read these instructions. Labs are timed and you cannot pause them. The timer, which starts when you click Start Lab, shows how long Google Cloud resources will be made available to you.
This hands-on lab lets you do the lab activities yourself in a real cloud environment, not in a simulation or demo environment. It does so by giving you new, temporary credentials that you use to sign in and access Google Cloud for the duration of the lab.
To complete this lab, you need:
- Access to a standard internet browser (Chrome browser recommended).
Note: Use an Incognito or private browser window to run this lab. This prevents any conflicts between your personal account and the Student account, which may cause extra charges incurred to your personal account.
- Time to complete the lab---remember, once you start, you cannot pause a lab.
Note: If you already have your own personal Google Cloud account or project, do not use it for this lab to avoid extra charges to your account.
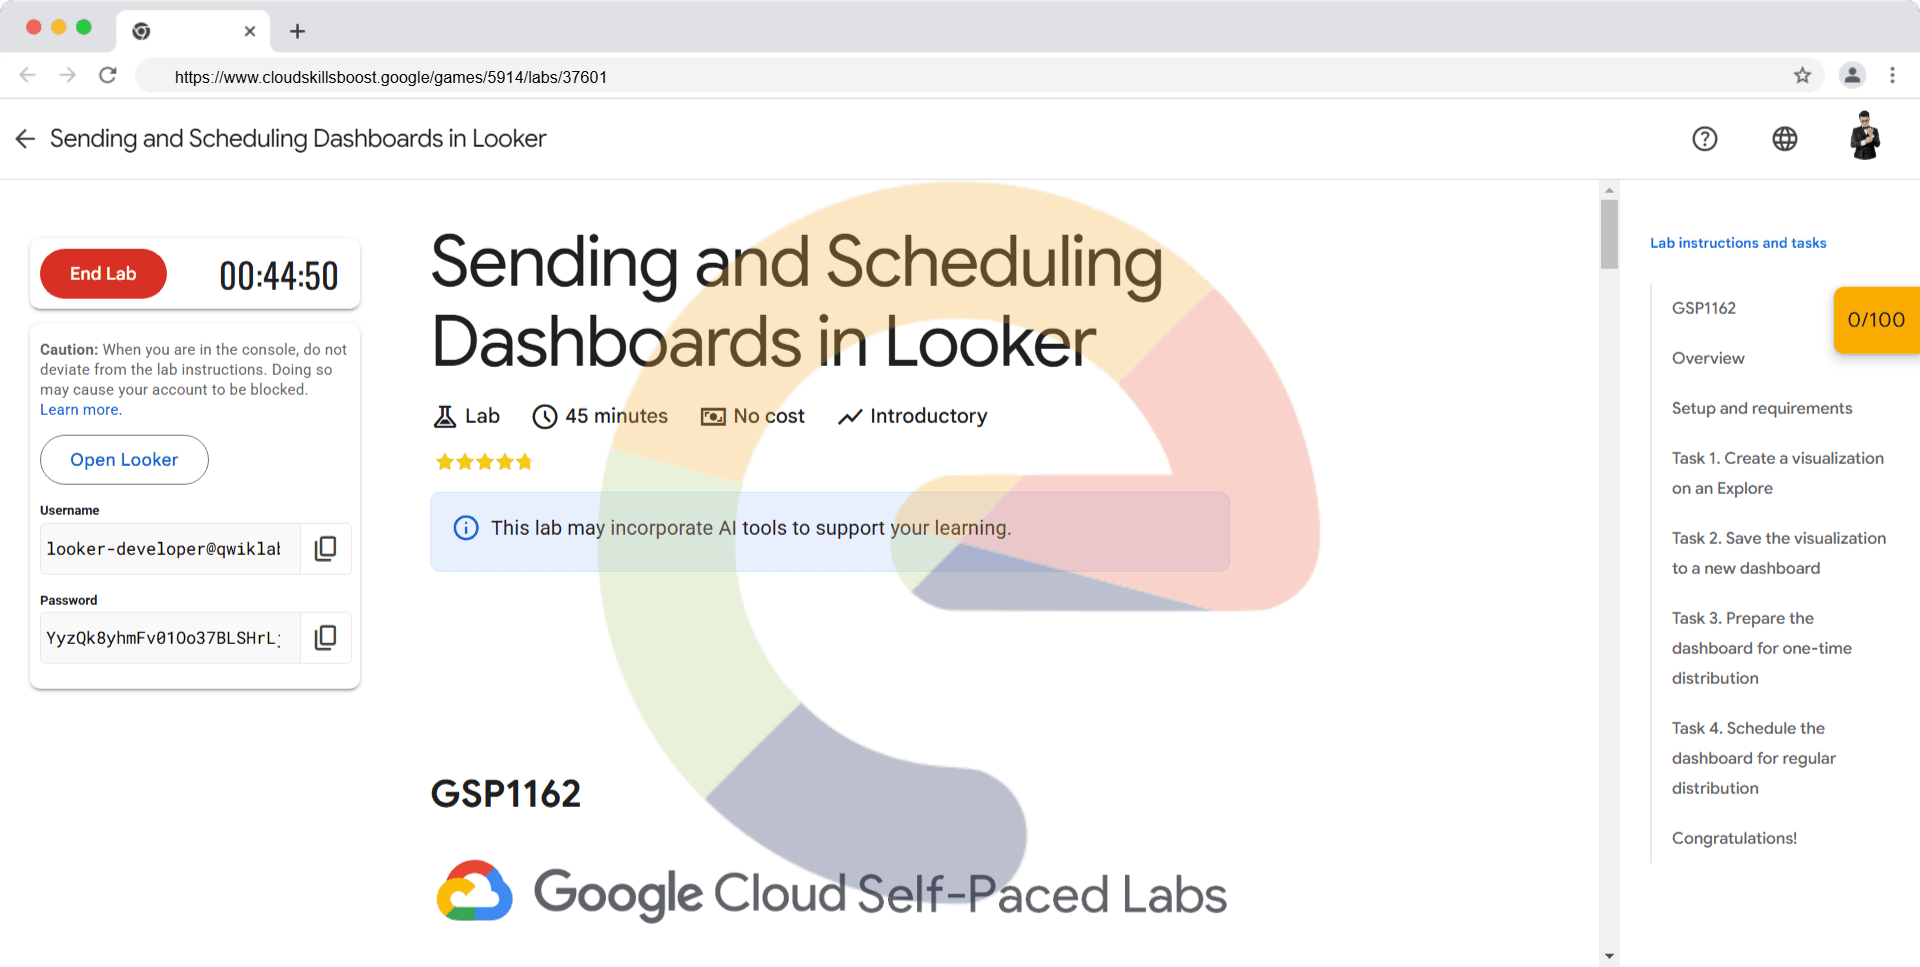
How to start your lab and sign in to Looker
When ready, click .
A new panel will appear with the temporary credentials that you must use for this lab.
If you need to pay for the lab, a pop-up will open for you to select your payment method.
Note your lab credentials in the left pane. You will use them to sign in to the Looker instance for this lab.
Note: If you use other credentials, you will get errors or incur charges.
Click Open Looker.
Enter the provided Username and Password in the Email and Password fields.
Important: You must use the credentials from the Connection Details panel on this page. Do not use your Google Cloud Skills Boost credentials. If you have your own Looker account, do not use it for this lab.
Click Log In.
After a successful login, you will see the Looker instance for this lab.
Task 1. Create a visualization on an Explore
In this task, create a new visualization from the "E-Commerce Training" Explore.
On the left-side navigation panel of the Looker User Interface, click Explore.
Under E-Commerce Training, click Order Items.
Under Users , click City.
Under Users, click Count. Click the header of Count to sort it decending.
Set row limit to 10. Click Run.
Click the arrow next to Visualization to expand the window and review the visualization in table chart.
Create a visualization
Check my progress
Task 2. Save the visualization to a new dashboard
In this task, you will save the visualization from Task 1 to a new dashboard.
From the gear menu at the top-right portion of the screen, choose the Save > As a new dashboard menu option.
Title your new Dashboard “Users count per City”. Select Developer Student folder and then click Save.
Back on the Explore interface, click View Dashboard.
Save the visualization
Check my progress
Task 3. Prepare the dashboard for one-time distribution
In this task, prepare the dashboard for one-time distribution.
From the last step in Task 2, you are in the editing mode of the dashboard. Click Cancel at the top-right portion of the screen to exit editing mode.
From within your dashboard, click the triple dot icon at the top-right portion of the screen, then select Schedule delivery for one-time distribution.
Configure your one-time dashboard send using the following instructions:
Give the report a title of Users count per City one-time send.
Under Recurrence, choose Send now.
Select the Email option for Destination and add
manager@example.comto the email address list.Choose PDF as the dashboard format type under Format.
At this point, you would click the Send now button to share your dashboard one time, but you will not do this here in the lab environment.
Task 4. Schedule the dashboard for regular distribution
In this final task, schedule the dashboard for regular distribution.
Return to your Users count per City dashboard.
From within your dashboard, click the triple dot icon at the top-right portion of the screen, then select Scheduled delivery for regular distribution.
Configure your dashboard schedule using the following instructions:
Give the dashboard title of Users count per City scheduled send.
Under Recurrence, choose Daily and 6:00 as Time.
Select the Email option for Destination and add
manager@example.comto the address list.Choose PDF as the dashboard format type under Format.
Under Advanced options, add a custom message of your choosing and change the Delivery timezone to America - New York.
At this point, you would click the Save button to save your new customized and delivery-scheduled dashboard, but you will not do this here in the lab environment.
Solution of Lab