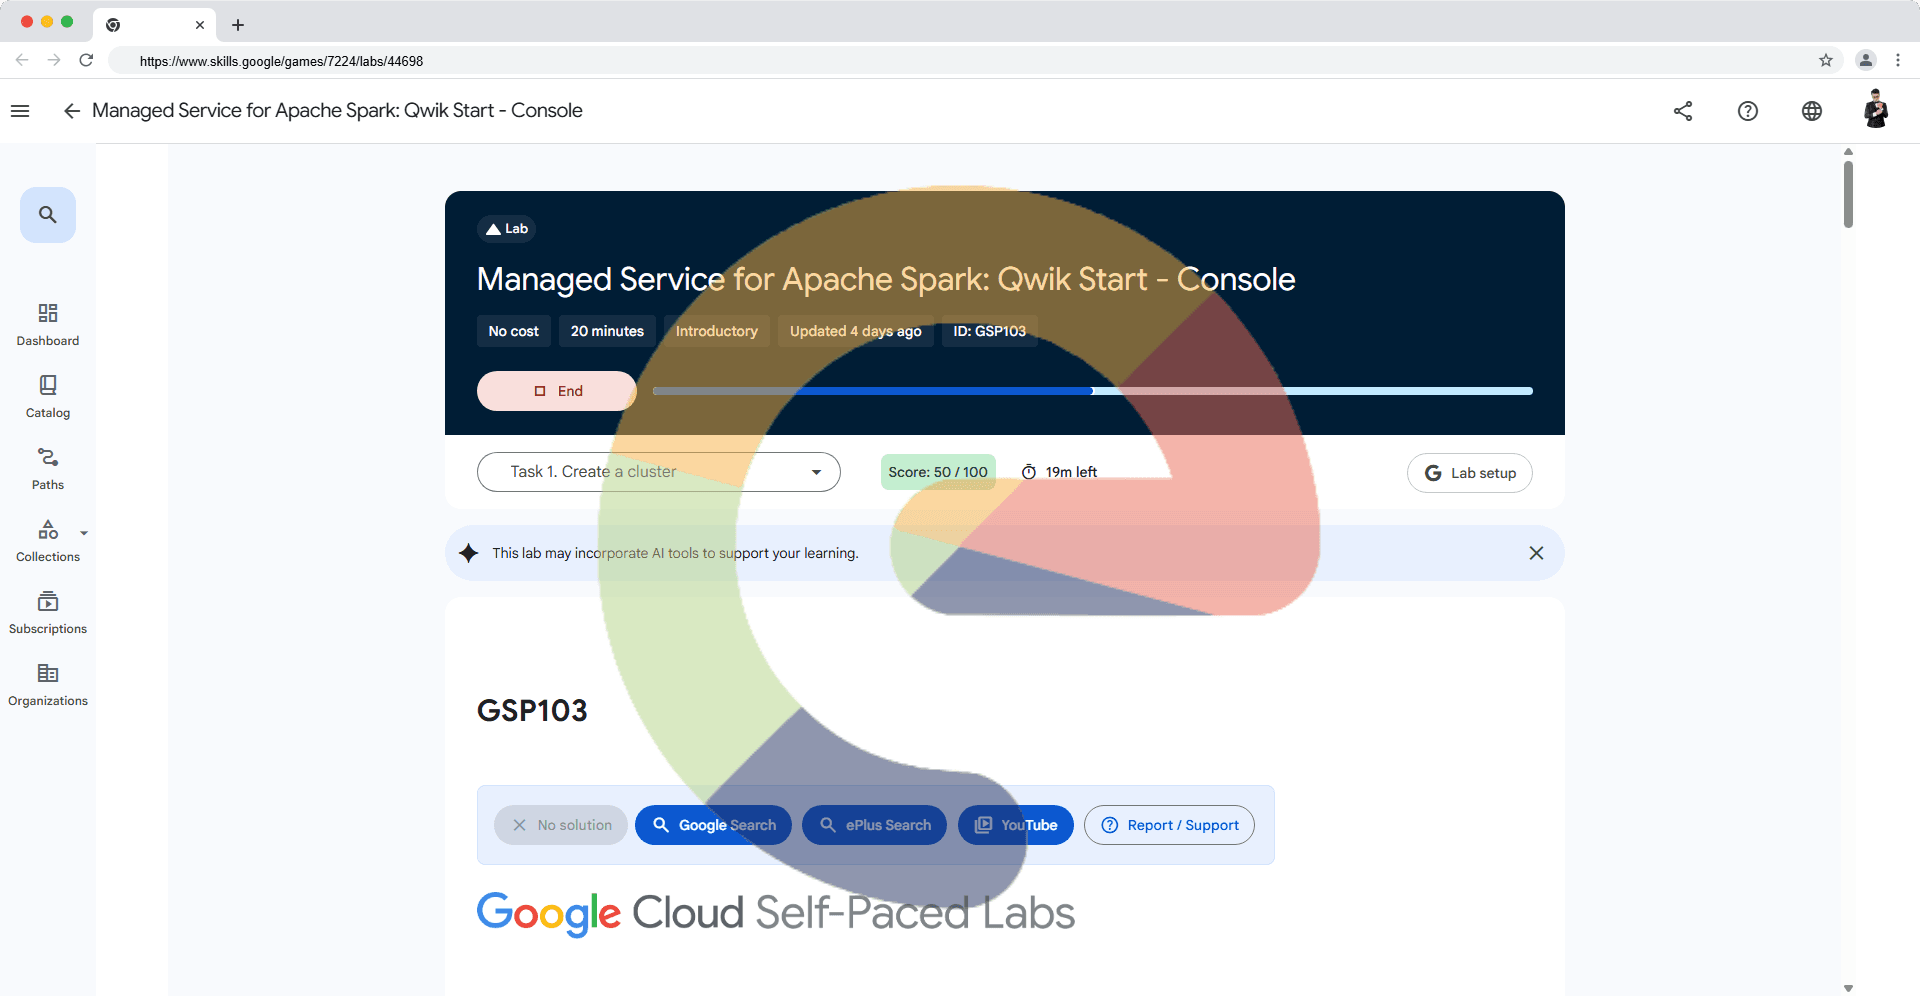
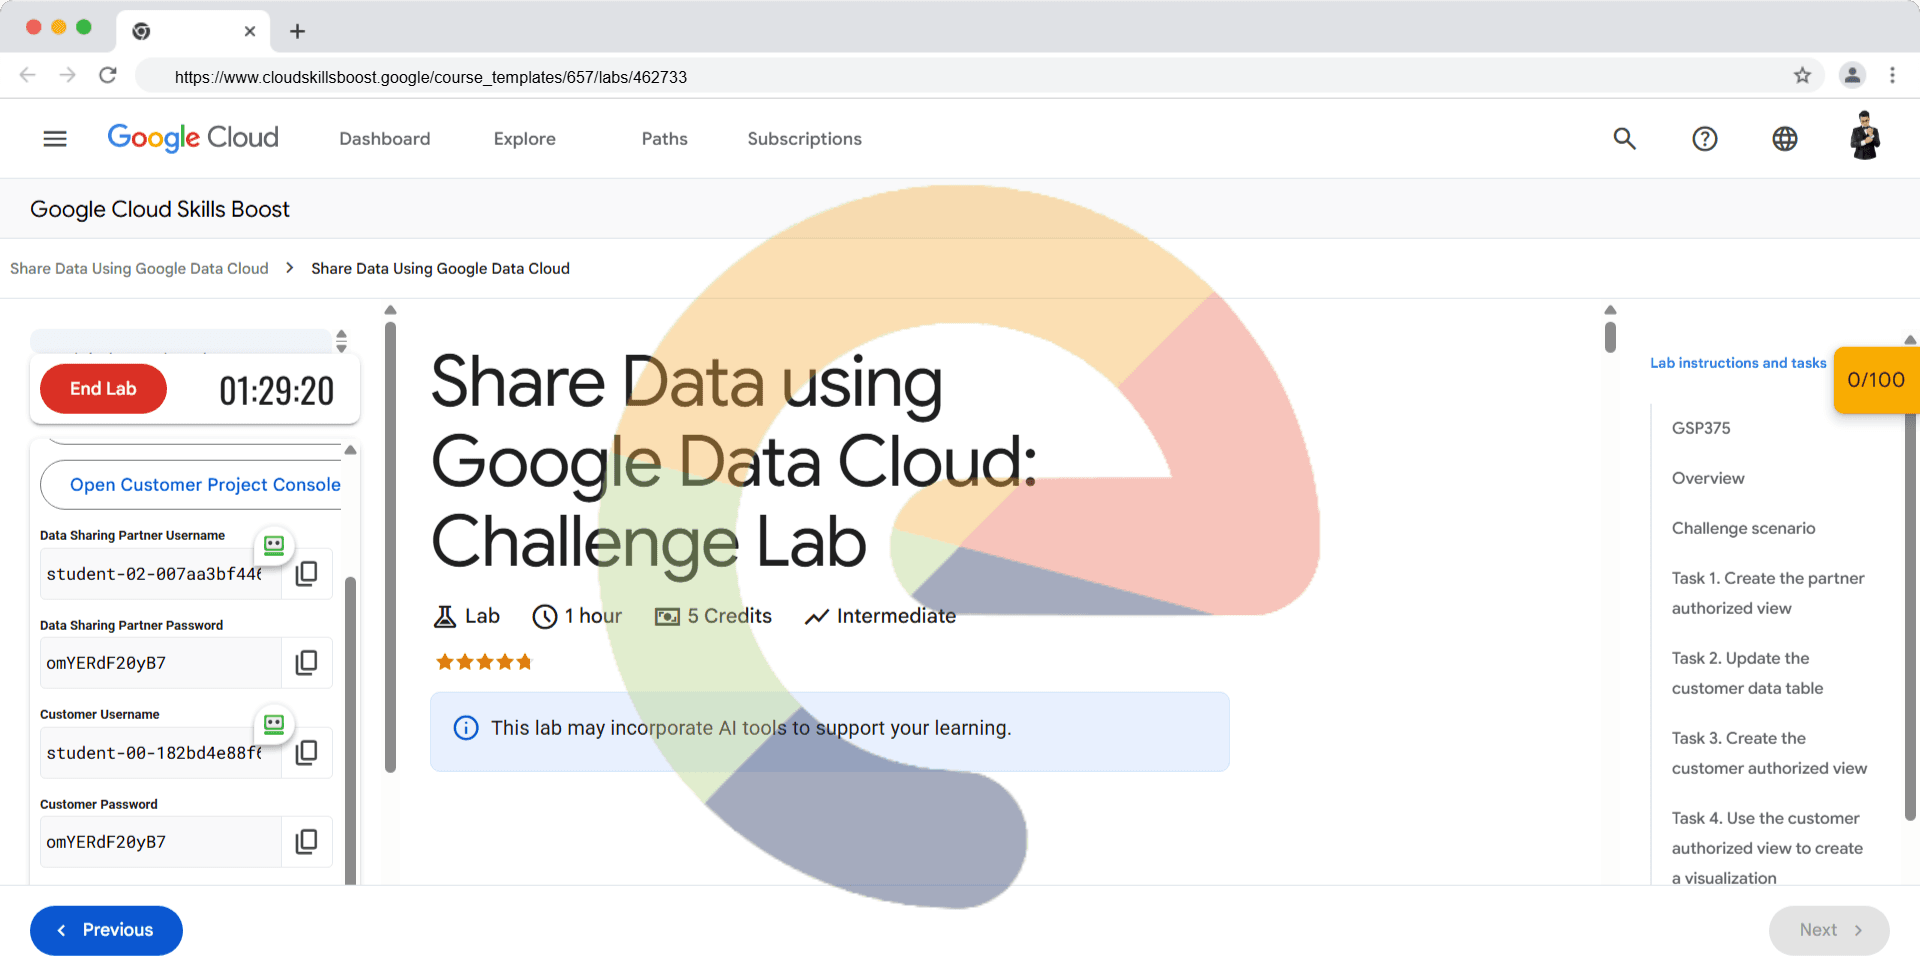
Share Data using Google Data Cloud: Challenge Lab - GSP375
A passionate full-stack developer from @ePlus.DEV
Overview
In a challenge lab you’re given a scenario and a set of tasks. Instead of following step-by-step instructions, you will use the skills learned from the labs in the course to figure out how to complete the tasks on your own! An automated scoring system (shown on this page) will provide feedback on whether you have completed your tasks correctly.
When you take a challenge lab, you will not be taught new Google Cloud concepts. You are expected to extend your learned skills, like changing default values and reading and researching error messages to fix your own mistakes.
To score 100% you must successfully complete all tasks within the time period!
This lab is recommended for students who have enrolled in the Share Data Using Google Data Cloud course. Are you ready for the challenge?
Topics tested:
Share BigQuery datasets across Google Cloud projects
Enrich datasets based on a curated data
Enable bi-directional data exchange
Create a visualization in Looker Studio
Setup and requirements
Before you click the Start Lab button
Read these instructions. Labs are timed and you cannot pause them. The timer, which starts when you click Start Lab, shows how long Google Cloud resources are made available to you.
This hands-on lab lets you do the lab activities in a real cloud environment, not in a simulation or demo environment. It does so by giving you new, temporary credentials you use to sign in and access Google Cloud for the duration of the lab.
To complete this lab, you need:
- Access to a standard internet browser (Chrome browser recommended).
Note: Use an Incognito (recommended) or private browser window to run this lab. This prevents conflicts between your personal account and the student account, which may cause extra charges incurred to your personal account.
- Time to complete the lab—remember, once you start, you cannot pause a lab.
Note: Use only the student account for this lab. If you use a different Google Cloud account, you may incur charges to that account.
Challenge scenario
You are a Google Cloud Data Sharing Partner hosting an application for multiple customers, storing data, and providing analytics as a service. The application caters to a customer that depends on your data to enrich their application data. In turn, the customer then shares high-level metrics with the Data Sharing Partner to better understand the customer footprint.
In this lab, you will be required to act as both the Data Sharing Partner and the customer by enabling bi-directional data exchange in BigQuery, as well as creating a visualization in Looker Studio.
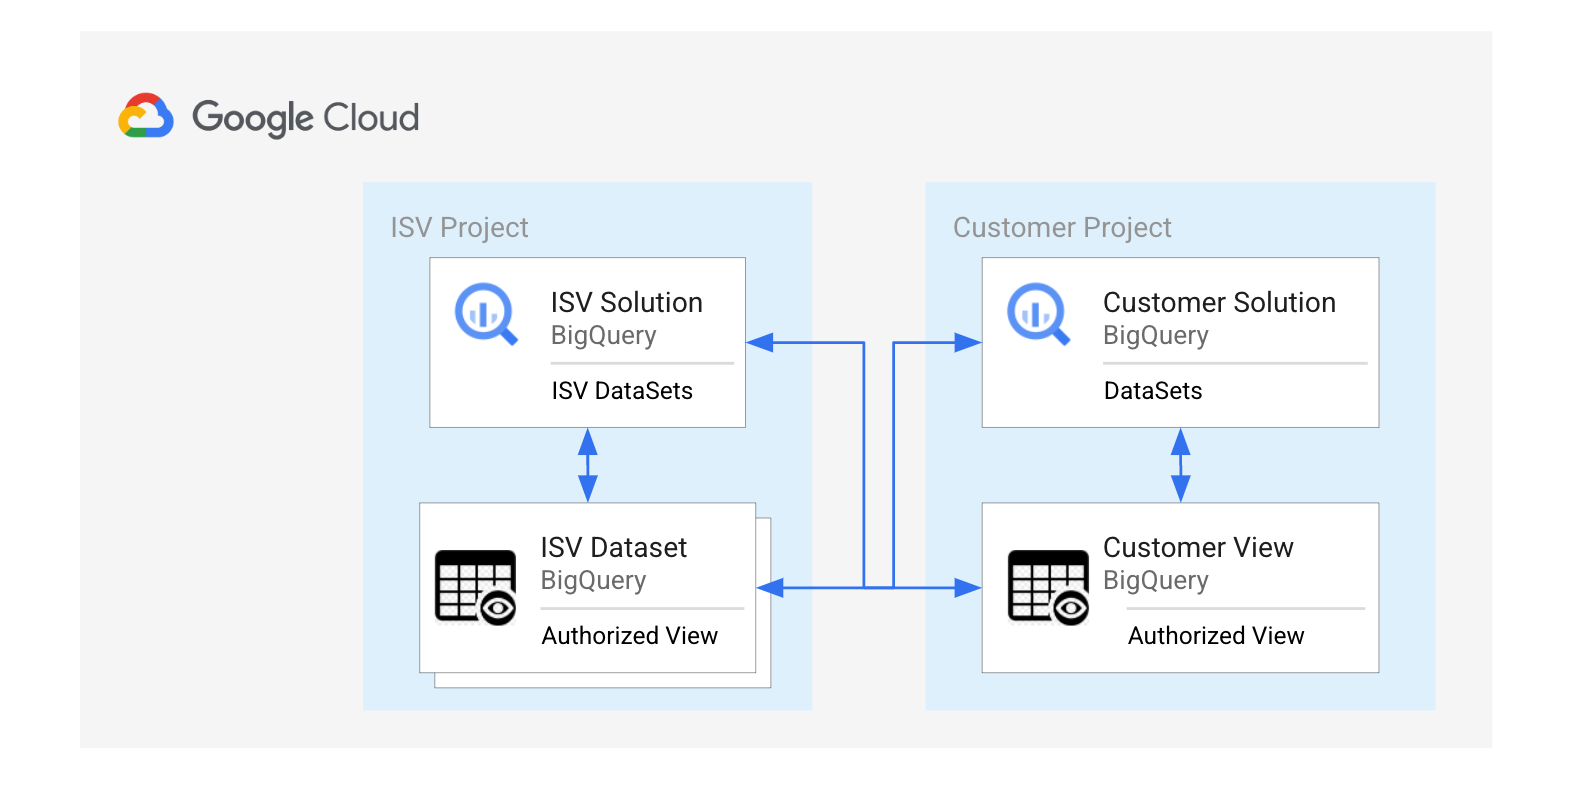
Task 1. Create the partner authorized view
Your first task as a Data Sharing Partner is to copy a BigQuery public dataset into your project. The dataset contains details of each zip code across the US. In this section, you will need to expose the loaded dataset as an authorized view and grant access to a specific customer user.
For this task, you will need to be logged into the Data Sharing Partner Project Console with the associated credentials.
- Create an authorized view named
authorized_view_sx7wbased off of the following query. Save it insidedemo_dataset.
SELECT
 *
FROM
 `bigquery-public-data.geo_us_boundaries.zip_codes`;
Copied!content_copy
Click Check my progress to verify the objective.
Create the partner authorized view
Check my progress
Authorize the view
Next, you will need to assign IAM permissions by authorizing the view in the dataset.
- Authorize the
authorized_view_sx7wview you just created.
Assign IAM permissions for the customer user
Next, you will need to grant the Customer user the BigQuery Data Viewer role on the authorized view you created.
Grant the customer user access to the
authorized_view_sx7wview.Their username is:
student-00-182bd4e88f65@qwiklabs.netGrant them the BigQuery Data Viewer role
Click Check my progress to verify the objective.
Authorize the view and Assign IAM permissions for the customer user
Check my progress
Task 2. Update the customer data table
In this task, you will be acting as the customer. Your next step is to run a query to update the customer table inside of your project.
For this task, you will need to be logged into the Customer Project Console with the associated credentials.
- Execute the query below to update the county value in the customer table.
UPDATE
 `qwiklabs-gcp-02-a698d7ab354d.customer_dataset.customer_info` cust
SET
cust.county=vw.county
FROM
`qwiklabs-gcp-03-84a0d21f7665.demo_dataset.authorized_view_sx7w` vw
WHERE
vw.zip_code=cust.postal_code;
Copied!content_copy
You should see the following result:
This statement modified 14 rows in customer_info.
Task 3. Create the customer authorized view
In this section, you will need to create a customer authorized view and grant access to a specific Data Sharing Partner user.
For this task, you will need to be logged into the Customer Project Console with the associated credentials.
- Create an authorized view named
customer_authorized_view_u82dbased off of the following query that lists the counties and number of customers in the listed counties. Save it insidecustomer_dataset.
SELECT
  county,
COUNT(1) AS Count
FROM
 `qwiklabs-gcp-02-a698d7ab354d.customer_dataset.customer_info` cust
GROUP BY
 county
HAVING county is not null
Copied!content_copy
Click Check my progress to verify the objective.
Create the customer authorized view
Check my progress
Authorize the view
Next, you will need to assign IAM permissions by authorizing the customer view in the dataset.
- Authorize the
customer_authorized_view_u82dview you just created.
Assign IAM permissions for the partner user
Next, you will need to grant the Data Sharing Partner user the BigQuery Data Viewer role on the customer authorized view you created.
Grant the Data Sharing Partner user access to the
customer_authorized_view_u82dview.Their username is:
student-02-007aa3bf4469@qwiklabs.netGrant them the BigQuery Data Viewer role
Click Check my progress to verify the objective.
Authorize the view and Assign IAM permissions for the partner user
Check my progress
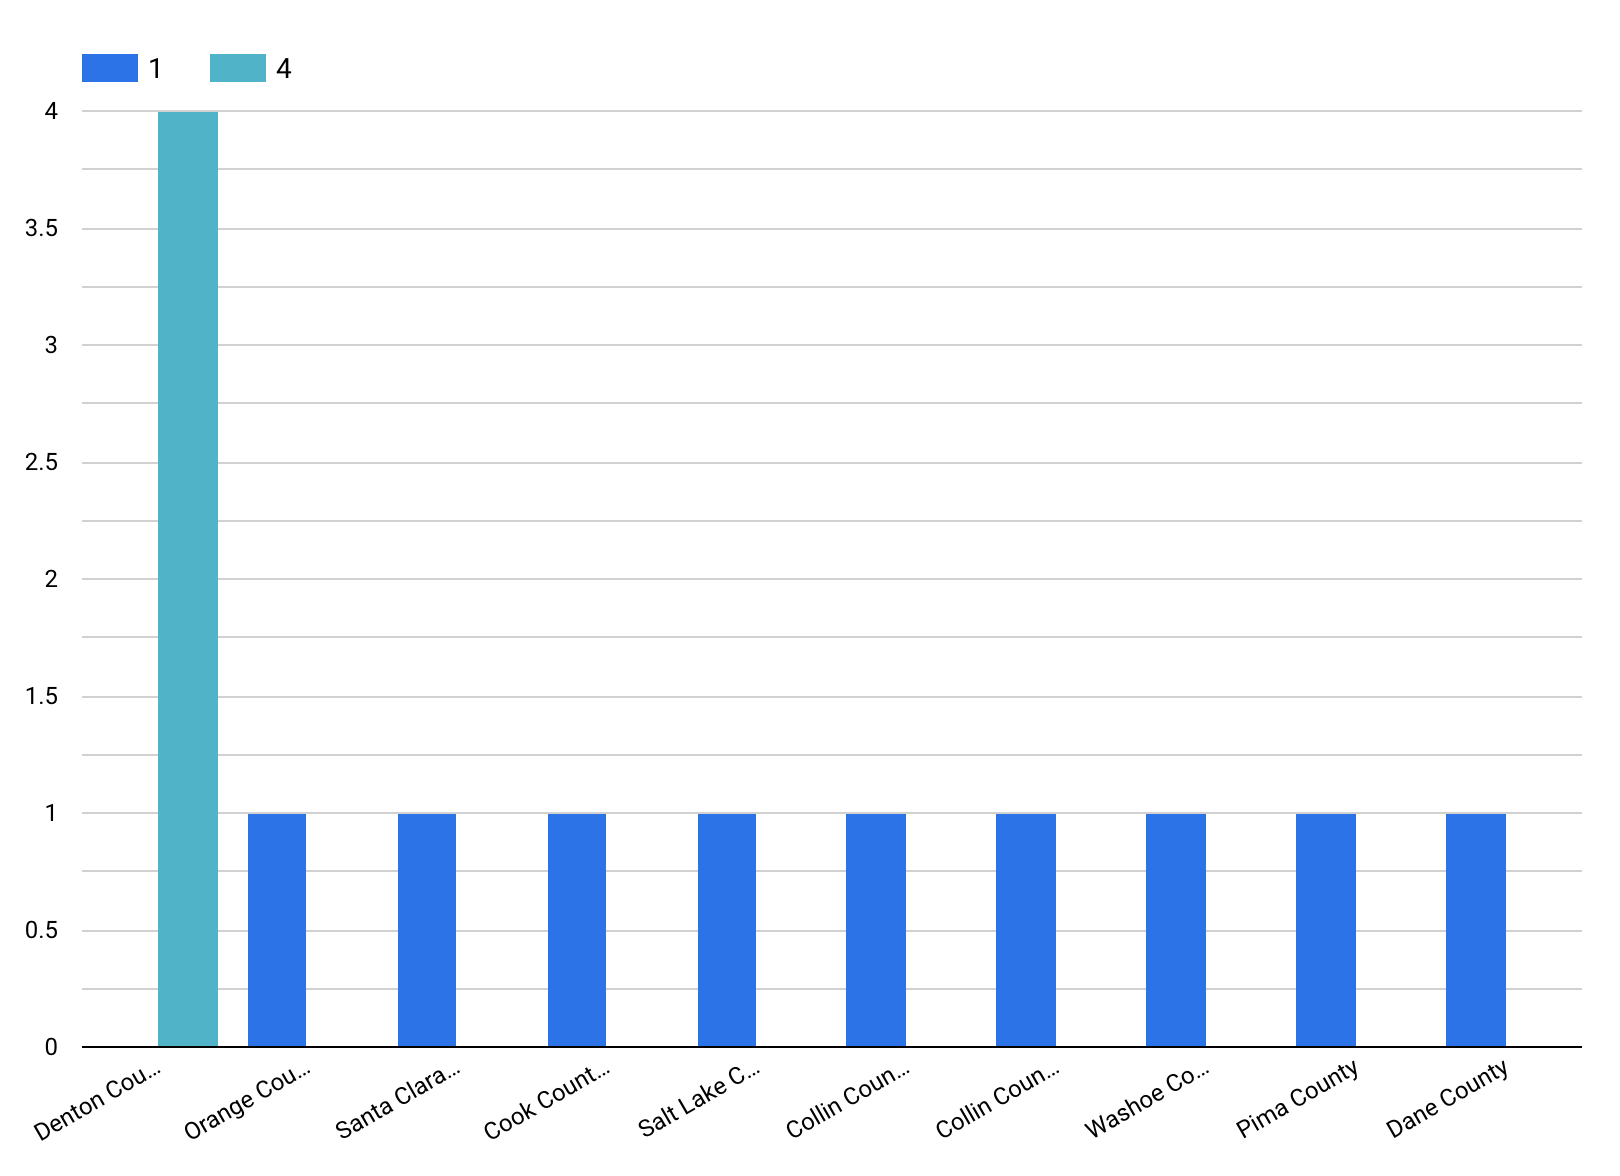
Task 4. Use the customer authorized view to create a visualization
Your fourth task is to consume the customer’s authorized view in the Data Sharing Partner project and create a column chart visualization that shows the distribution of the customers and counties.
For this task, you will need to be logged into the Data Sharing Partner Project Console with the associated credentials.
Connect BigQuery to Looker Studio
Open Google Looker Studio and create a Blank Report.
Connect BigQuery and authorize to Looker Studio.
From My Projects on the left pane, navigate to the customer project and select
customer_authorized_view_u82d. Add the table to the blank report.
Click Check my progress to verify the objective.
Connect BigQuery to Looker Studio
Check my progress
Create a visualization in Looker Studio
Create a visualization with the following requirements:
Report name:
Data Sharing Partner VizualizationFor the visualization, insert a Column Chart
For the Column Chart, set
countyas the Dimension andCountas the Breakdown Dimension and Metric.
The visualization should resemble the following:
Solution of Lab
🥇 Task 1: Create the Partner Authorized View
🔑 Work in the Data Sharing Partner Project Console
Open BigQuery Console → make sure you are in the Data Sharing Partner project.
Create the authorized view inside
demo_dataset:
CREATE OR REPLACE VIEW `demo_dataset.authorized_view_b9g4` AS
SELECT
  *
FROM
  `bigquery-public-data.geo_us_boundaries.zip_codes`;
✅ Authorize the view:
Go to
demo_dataset→ SHARE DATASET → Authorized ViewsAdd the view:
demo_dataset.authorized_view_b9g4
✅ Grant IAM permissions to the customer user:
Go to IAM → Grant Access
Add email:
student-01-a8002e448ea7@qwiklabs.netRole: BigQuery Data Viewer
🥈 Task 2: Update the Customer Data Table
🔑 Work in the Customer Project Console
Open BigQuery Console → switch to the Customer project.
Run the following query to update the
countyfield:
UPDATE
  `qwiklabs-gcp-04-6d5854c77740.customer_dataset.customer_info` cust
SET
  cust.county = vw.county
FROM
  `qwiklabs-gcp-01-799db57f207f.demo_dataset.authorized_view_b9g4` vw
WHERE
  vw.zip_code = cust.postal_code;
👉 You should see this result:This statement modified 14 rows in customer_info.
🥉 Task 3: Create the Customer Authorized View
🔑 Still in the Customer Project Console
- Create the authorized view inside
customer_dataset:
CREATE OR REPLACE VIEW `customer_dataset.customer_authorized_view_mz9o` AS
SELECT
  county,
  COUNT(1) AS Count
FROM
  `qwiklabs-gcp-04-6d5854c77740.customer_dataset.customer_info` cust
GROUP BY
  county
HAVING
  county IS NOT NULL;
✅ Authorize the view:
Go to
customer_dataset→ SHARE DATASET → Authorized ViewsAdd:
customer_dataset.customer_authorized_view_mz9o
✅ Grant IAM permissions to the partner user:
Go to IAM → Grant Access
Add email:
student-01-52643675794b@qwiklabs.netRole: BigQuery Data Viewer
🏆 Task 4: Create a Visualization with Looker Studio
🔑 Switch back to the Data Sharing Partner Project
Open Looker Studio → create a Blank Report.
Connect to BigQuery → go to My Projects → navigate to the Customer project → select:
customer_dataset.customer_authorized_view_mz9oBuild the visualization:
Report name:
Data Sharing Partner VisualizationInsert a Vertical Bar Chart
Dimension:
countyMetric:
Count
✅ The chart should display the number of customers by county.