Using Custom Fields in Looker Explores - GSP983
A passionate full-stack developer from @ePlus.DEV
Overview
Looker provides the ability for non-developer users to create and utilize ad hoc fields for richer data analysis. This is done by creating custom measures, custom dimensions, table calculations and using custom groupings to narrow down data to match specific conditions.
Using ad hoc fields gives non-developers the ability to create new fields, as opposed to regular fields, which require that you have development permissions and understand LookML allowing them to have more flexibility in finding data they are looking for independently.
Objectives
In this lab, you will learn how to:
Create custom measures based on an existing dimension
Create custom groupings
Adding filters to custom measures
Use table calculations on numeric fields without writing Looker functions or operators
Task 1. Create a custom measure
In this section, you will create a custom measure based on an existing dimension.
Using the dimension's three-dot Options menu
First, on the bottom left of the Looker User Interface, click the toggle button to enter Development mode.
Click the Explore tab and then select E-Commerce Training > Order Items.
Expand the Inventory Items section.
Click More () next to the Cost dimension to review the custom fields you can add.
Select the Aggregate > Average custom field to create a measure that calculates the average of an order item’s cost.
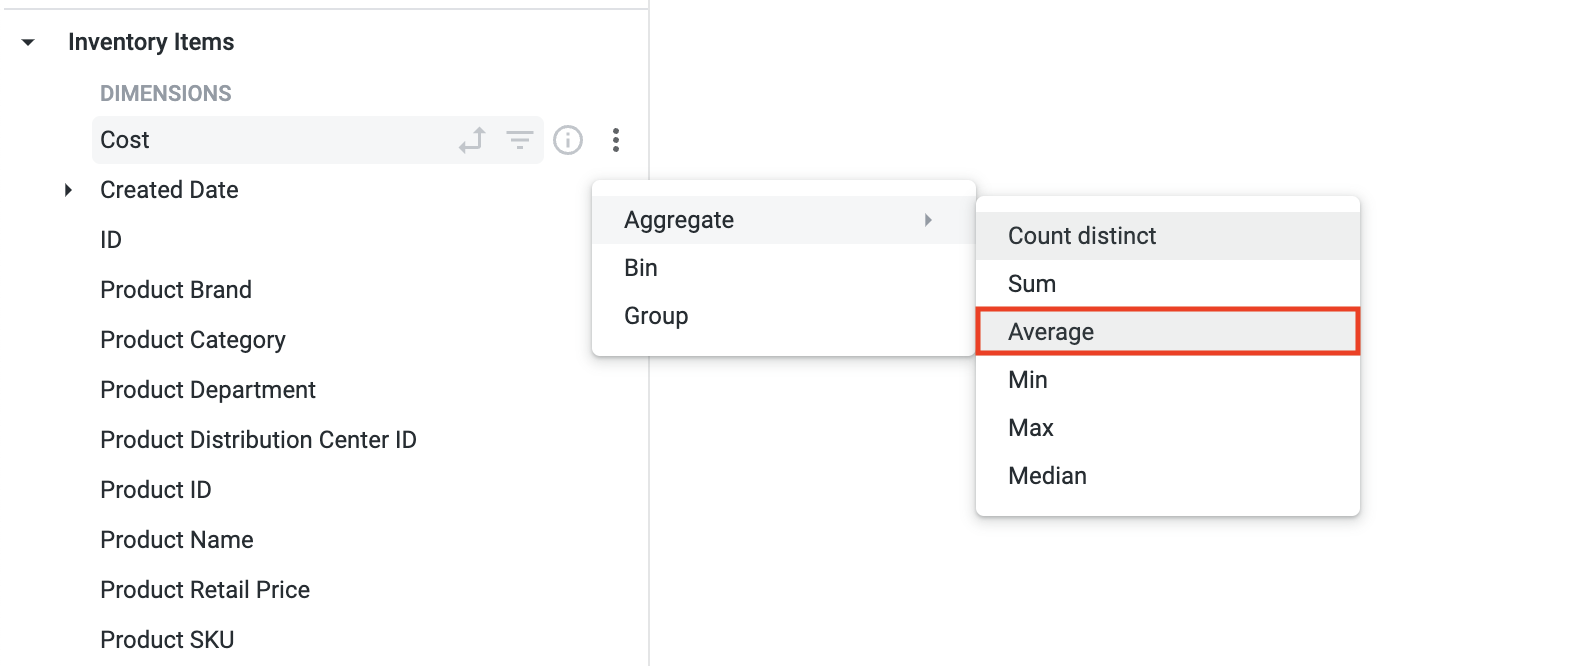
The suggested functions vary based on the type of dimension you’ve chosen (such as number, text, and date). If you select count, a count distinct is executed in the generated SQL. Your new field is automatically added to the query.
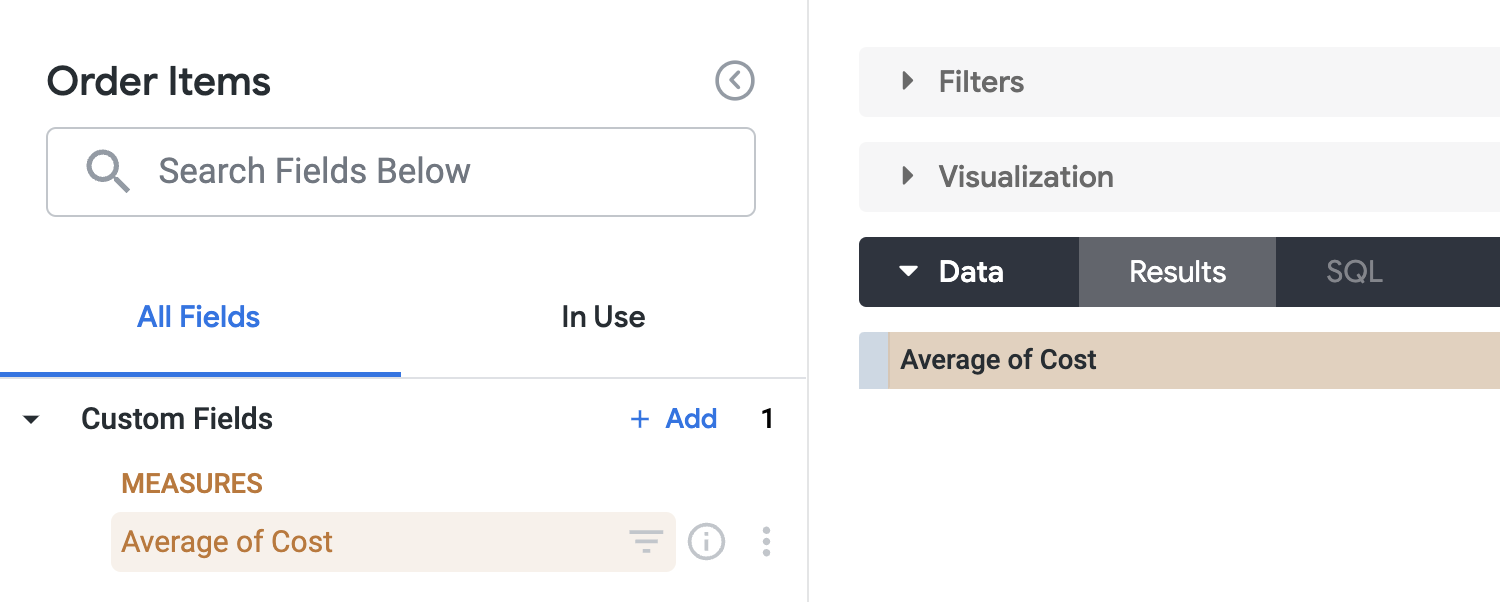
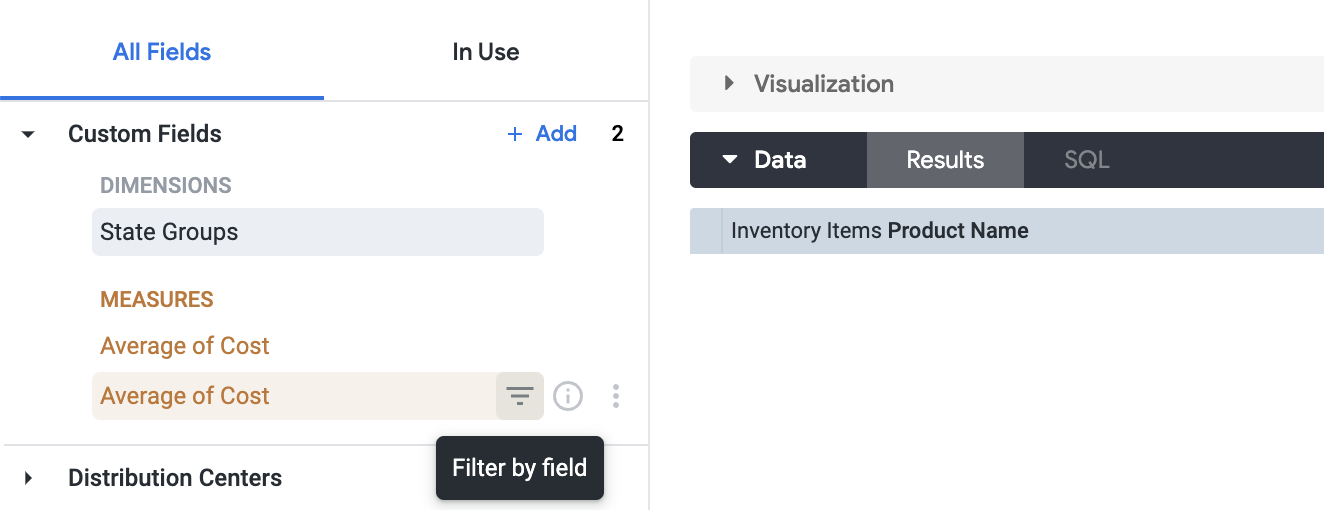
Expand the Custom Fields section to see your new field.
As with other fields, you can click a custom field’s name to add or remove it from a query. You can also hover over the field to reveal more options available for that field, including clicking its Filter by field icon to use it as a filter in a query.
Using the Custom Fields section
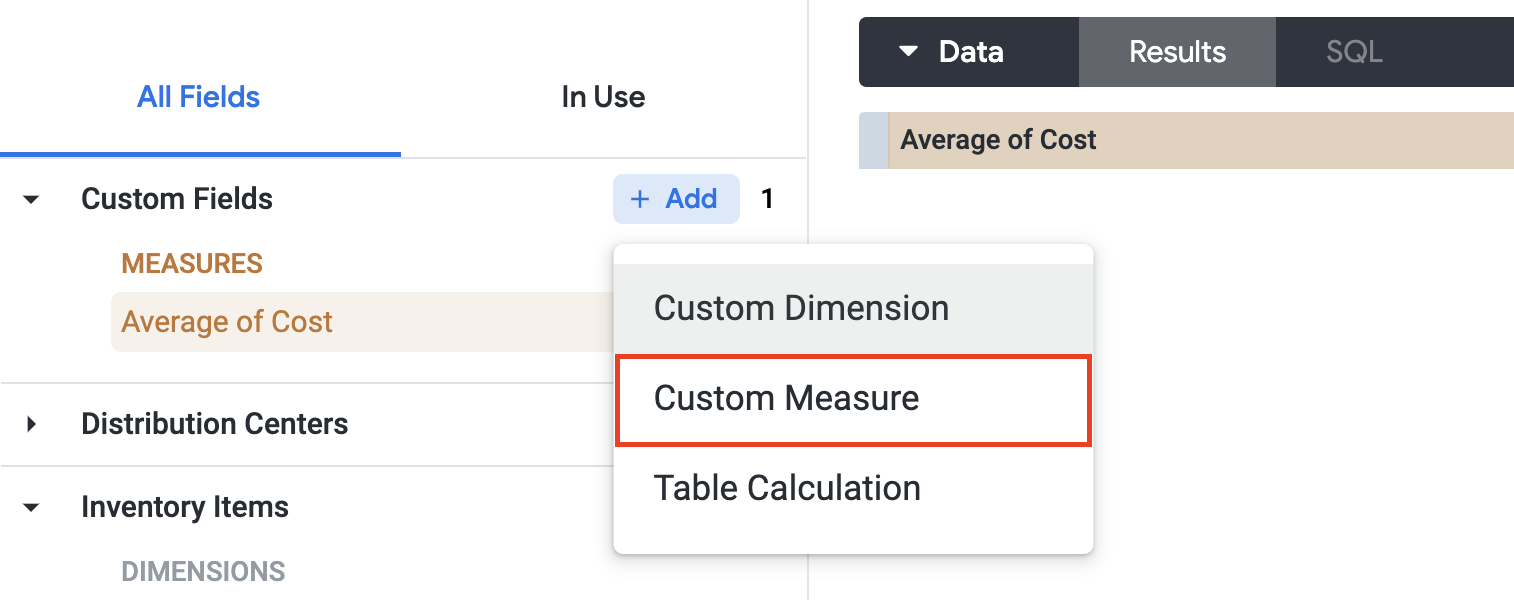
If you want to define a format or a filter for your custom measure while creating it, start with the + Add button on the Custom Fields section.
Expand the Custom Fields section.
Click + Add and then select Custom Measure.
Set the Field to measure to Inventory Items >
Cost.Set the Measure type to
Average.Set the Name to
Average of Cost.On the Field details tab set the following:
Format: U.S. DollarsDecimals: 2
- Click Save.
Task 2. Create a custom grouping
The Group custom field type lets you create ad hoc custom groups for dimensions and custom dimensions without needing to use logical functions in Looker expressions or needing to develop CASE WHEN logic in sql parameters or type: case fields.
This can be helpful when you want to assign fixed labels or category names to values that match specific conditions, for example, by grouping specific states or countries into regions or order costs into categories.
You should now see two Average of Cost custom fields in the Custom Fields section. Select just the bottom one to add it to the query.
Expand the Inventory Items section and select the Product Name dimension to add it to the query.
Expand the Users section and select the Filter by field icon for the Country dimension and set the drop down to
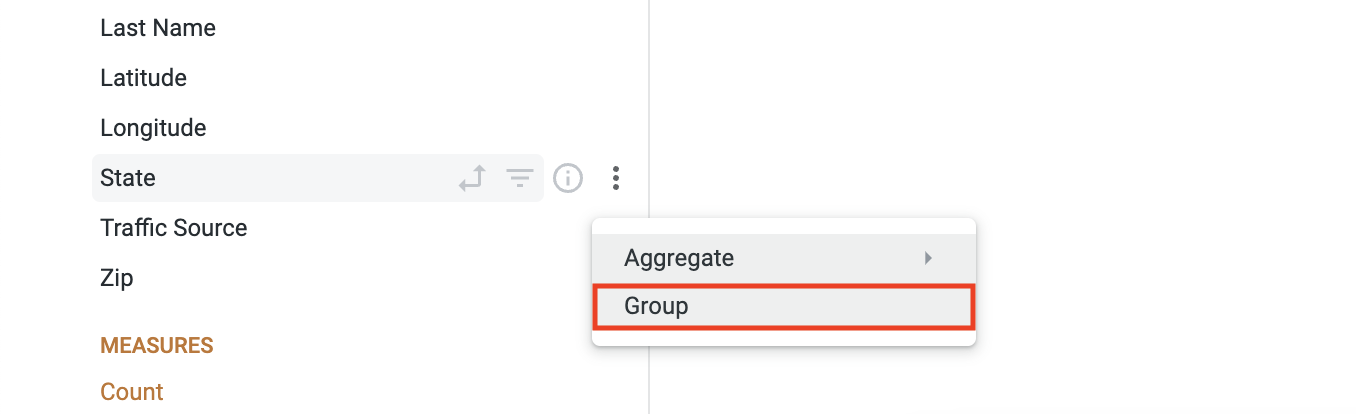
is equal toand the value to USA.Next, click More () next to State under the Users section and select Group.
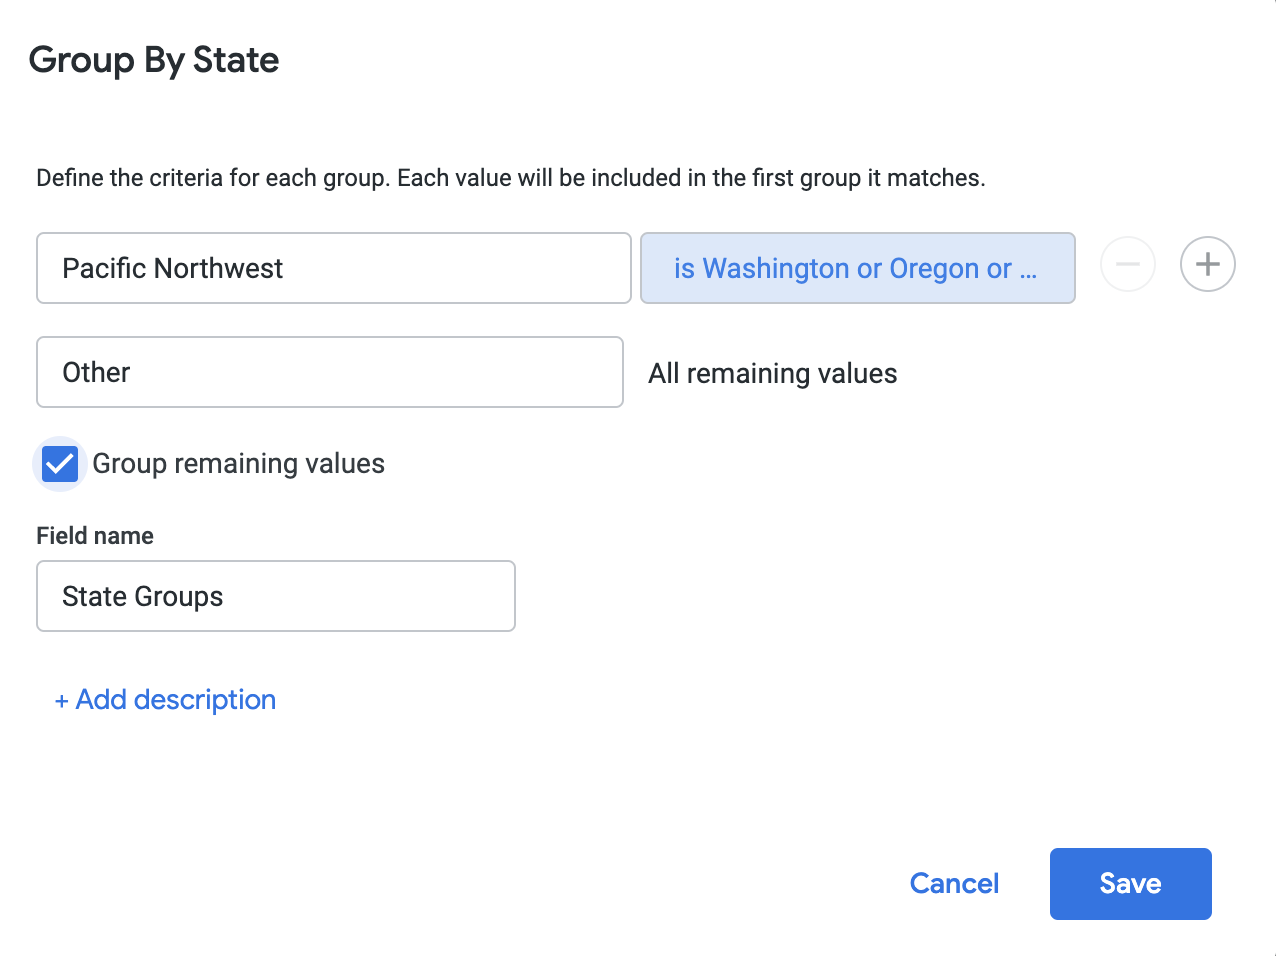
In the Group By State dialog, set the Add group name to
Pacific Northwest.Click the
is any valueinput box and add Oregon, Idaho and Washington to the list independently.Check the Group remaining values checkbox then click Save.
- Select the newly create
State Groupscustom field to add it to the Explore and click Run in the top right of the page.
The result will be a view of the average cost of various product names grouped by Pacific Northwest and Other.
Task 3. Adding a filter to a custom measure
Now that you have a view of the average cost of various product names grouped by Pacific Northwest and Other, say you wanted to only view products with an average cost greater than $200 (USD).
To enhance the current view do the following:
- Under the Custom Fields section select the Filter by field icon for the bottom
Average of Costunder Measures.
Set the drop down to
is greater thanand set its value to 200.Re-run the query by clicking on the Run button in the top right of the page to view the results.
You will now see a filtered view with only the average of cost products greater than $200 (USD).
Click Check my progress to verify the objective.
Create a custom measure
Check my progress
Task 4. Using table calculations
Say you wanted to understand the count of orders for each item in the view from the last section. To filter the view further you could add the Order Count and use the Percentage of Column quick calculation to get an idea of how popular a product is by the State Groups custom field created earlier in this lab.
Under Order Items section, click Order Count to add it to the view.
In the data view, click Settings () on the Order Count column.
Click Calculations > % of column.
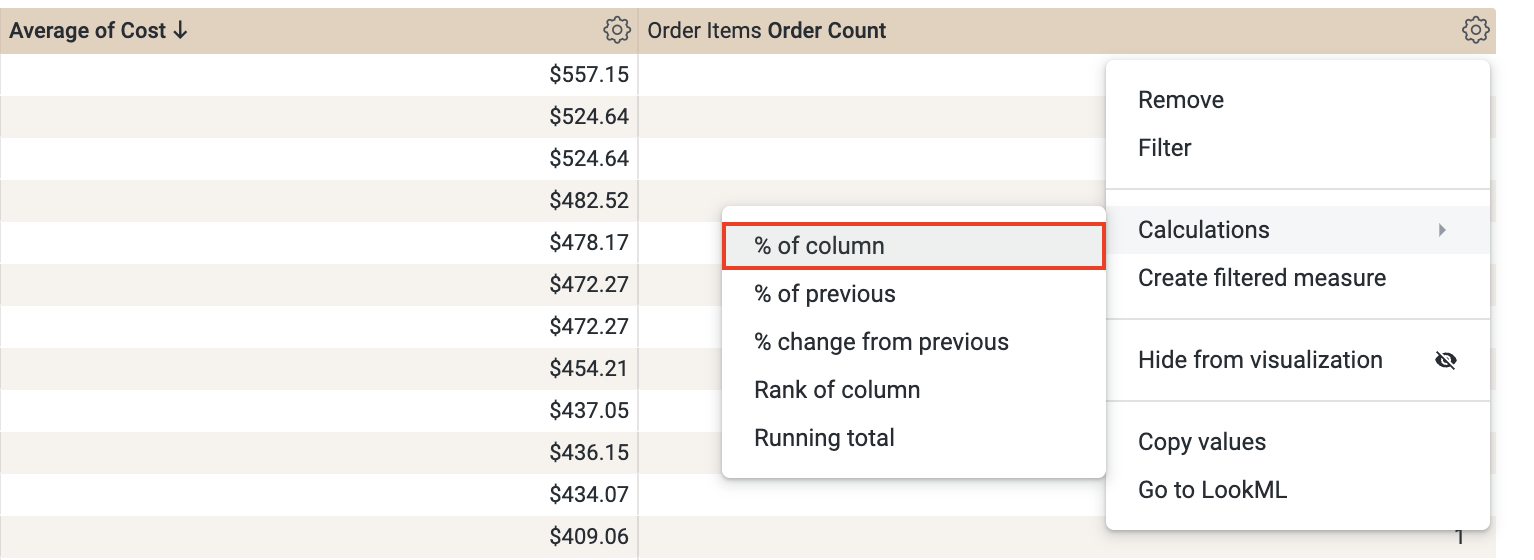
A new table calculation column with the percentage of Order Count should be populated into the Explore.
- Click Run at the top right hand side of the page. This will re-run the previous query and the result will display the order item count and percentage of the table that each row represents in the resulting view. This will give an analyst insights into what product is popular by the State Grouping group created earlier.
Click Check my progress to verify the objective.
Solution of Lab
🚀 Task 1: Create a custom measure
Toggle on Development Mode (find it at the bottom-left corner).
Navigate to Explore > E-Commerce Training > Order Items.
Expand the Inventory Items section.
Click the More options (⋮) icon next to the Cost field.
Choose Aggregate > Average.
Expand Custom Fields to see your newly created measure.
Alternatively, you can create it manually:
In Custom Fields, click + Add > Custom Measure.
Field to measure:
Inventory Items > CostMeasure type:
AverageName:
Average of CostFormat:
U.S. DollarsDecimals:
2Click Save.
📊 Task 2: Create a custom grouping
In the Custom Fields section, select your Average of Cost measure (the one at the bottom if there are duplicates) to add it to your query.
Add Product Name (from Inventory Items) to the query.
Add Country (from Users), then click the filter icon:
- Set the filter to is equal to > USA.
Click the More options (⋮) icon next to State (from Users) and select Group.
Configure the Group By State settings:
Group name:
Pacific NorthwestAdd these values: Oregon, Idaho, Washington.
Ensure Group remaining values is checked.
Click Save.
Select the newly created State Groups field to add it to your view.
Click Run.
🔍 Task 3: Adding a filter to a custom measure
In Custom Fields, find your Average of Cost measure (again, the bottom one if duplicated) and click its Filter by field icon.
Set the filter condition to is greater than > 200.
Click Run.
🧮 Task 4: Using table calculations
Add Order Count (from Order Items) to your query.
Click the Settings (⚙️) icon on the Order Count column in your results table.
Select Calculations > % of column.
Click Run.