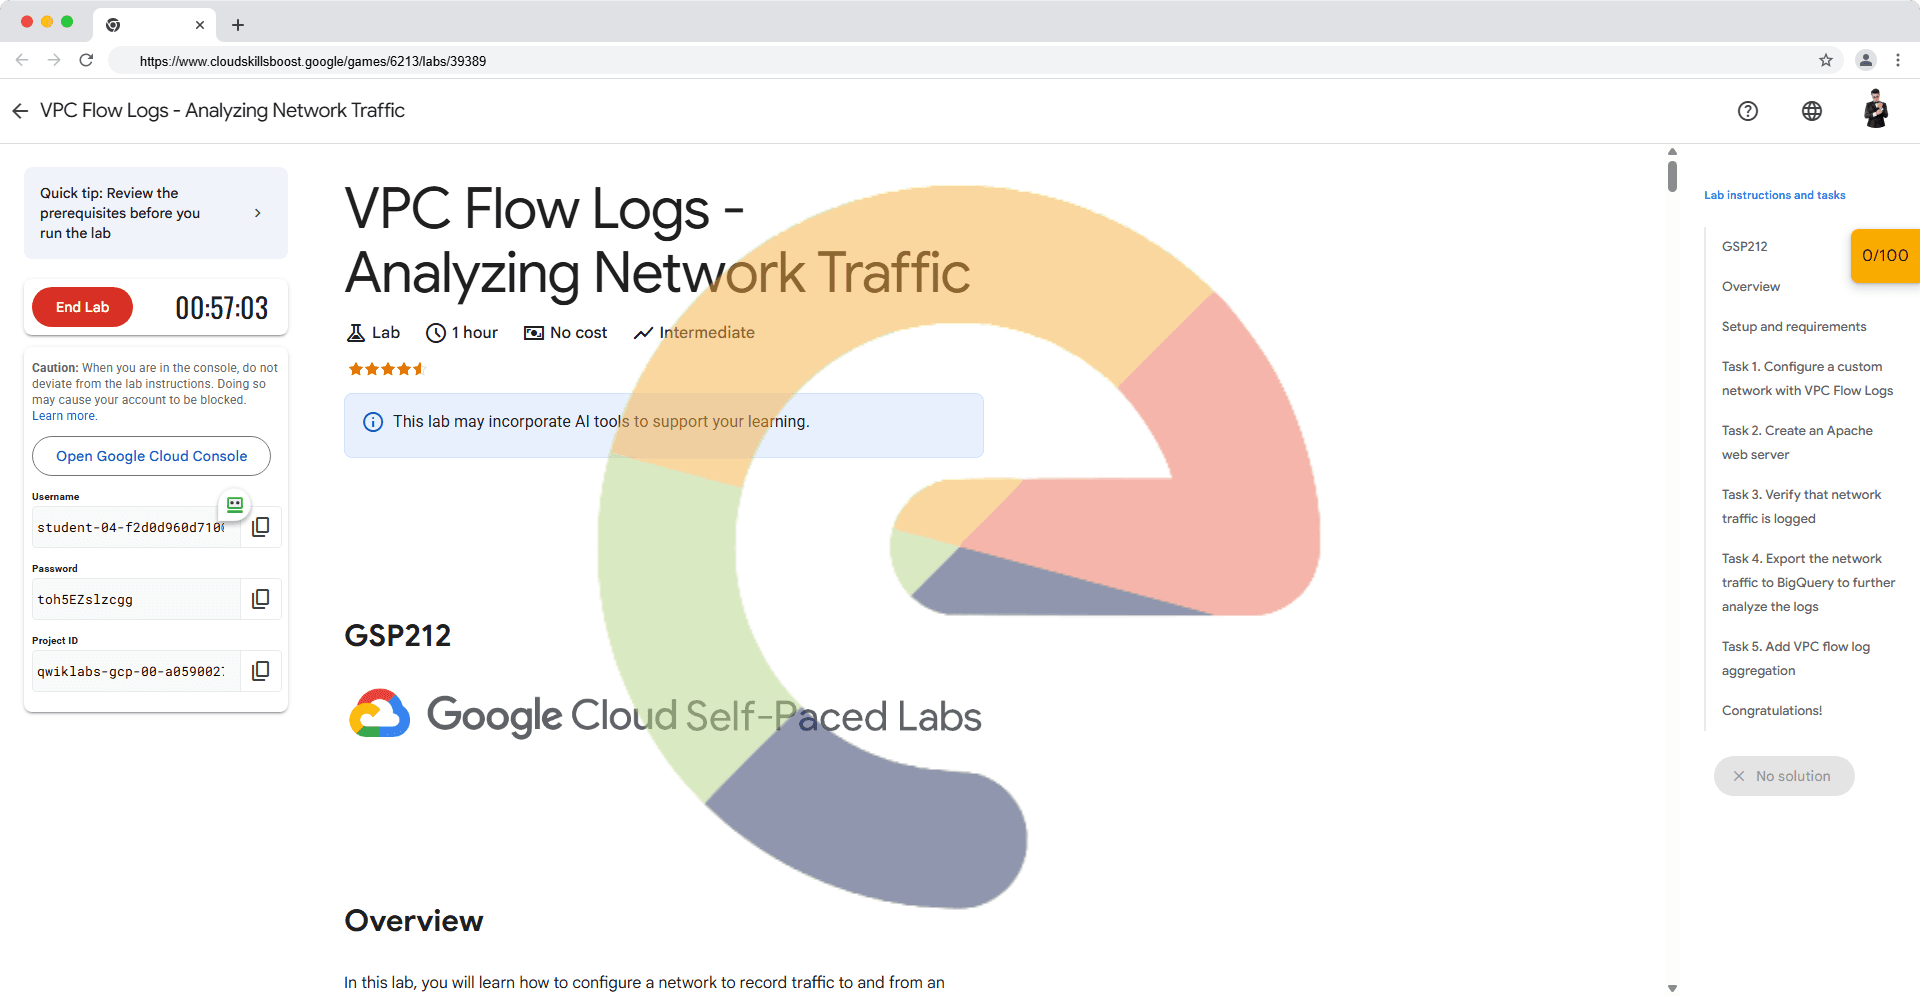
VPC Flow Logs - Analyzing Network Traffic - GSP212
A passionate full-stack developer from @ePlus.DEV
Setup and requirements
Before you click the Start Lab button
Read these instructions. Labs are timed and you cannot pause them. The timer, which starts when you click Start Lab, shows how long Google Cloud resources are made available to you.
This hands-on lab lets you do the lab activities in a real cloud environment, not in a simulation or demo environment. It does so by giving you new, temporary credentials you use to sign in and access Google Cloud for the duration of the lab.
To complete this lab, you need:
- Access to a standard internet browser (Chrome browser recommended).
Note: Use an Incognito (recommended) or private browser window to run this lab. This prevents conflicts between your personal account and the student account, which may cause extra charges incurred to your personal account.
- Time to complete the lab—remember, once you start, you cannot pause a lab.
Note: Use only the student account for this lab. If you use a different Google Cloud account, you may incur charges to that account.
How to start your lab and sign in to the Google Cloud console
Click the Start Lab button. If you need to pay for the lab, a dialog opens for you to select your payment method. On the left is the Lab Details pane with the following:
The Open Google Cloud console button
Time remaining
The temporary credentials that you must use for this lab
Other information, if needed, to step through this lab
Click Open Google Cloud console (or right-click and select Open Link in Incognito Window if you are running the Chrome browser).
The lab spins up resources, and then opens another tab that shows the Sign in page.
Tip: Arrange the tabs in separate windows, side-by-side.
Note: If you see the Choose an account dialog, click Use Another Account.
If necessary, copy the Username below and paste it into the Sign in dialog.
student-04-f2d0d960d710@qwiklabs.netYou can also find the Username in the Lab Details pane.
Click Next.
Copy the Password below and paste it into the Welcome dialog.
toh5EZslzcggYou can also find the Password in the Lab Details pane.
Click Next.
Important: You must use the credentials the lab provides you. Do not use your Google Cloud account credentials.
Note: Using your own Google Cloud account for this lab may incur extra charges.
Click through the subsequent pages:
Accept the terms and conditions.
Do not add recovery options or two-factor authentication (because this is a temporary account).
Do not sign up for free trials.
After a few moments, the Google Cloud console opens in this tab.
Note: To access Google Cloud products and services, click the Navigation menu or type the service or product name in the Search field.

Activate Cloud Shell
Cloud Shell is a virtual machine that is loaded with development tools. It offers a persistent 5GB home directory and runs on the Google Cloud. Cloud Shell provides command-line access to your Google Cloud resources.
Click Activate Cloud Shell at the top of the Google Cloud console.
Click through the following windows:
Continue through the Cloud Shell information window.
Authorize Cloud Shell to use your credentials to make Google Cloud API calls.
When you are connected, you are already authenticated, and the project is set to your Project_ID, qwiklabs-gcp-00-a05900279721. The output contains a line that declares the Project_ID for this session:
Your Cloud Platform project in this session is set to qwiklabs-gcp-00-a05900279721
gcloud is the command-line tool for Google Cloud. It comes pre-installed on Cloud Shell and supports tab-completion.
- (Optional) You can list the active account name with this command:
gcloud auth list
- Click Authorize.
Output:
ACTIVE: *
ACCOUNT: student-04-f2d0d960d710@qwiklabs.net

To set the active account, run:
    $ gcloud config set account `ACCOUNT`
- (Optional) You can list the project ID with this command:
gcloud config list project
Output:
[core]
project = qwiklabs-gcp-00-a05900279721
Note: For full documentation of gcloud, in Google Cloud, refer to the gcloud CLI overview guide.
Task 1. Configure a custom network with VPC Flow Logs
Create the custom network
By default, VPC Flow Logs are disabled for a network. Therefore, you will create a new custom-mode network and enable VPC Flow Logs.
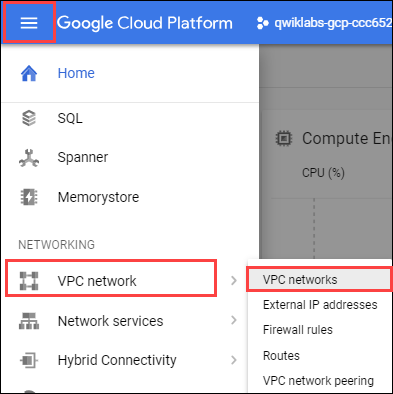
In the Console, navigate to Navigation menu () > VPC network > VPC networks.
Click Create VPC Network.
Set the following values, leave all others at their defaults:
Property Value (type value or select option as specified) Name vpc-net Description Enter an optional description For Subnet creation mode, click Custom.
Set the following values, leave all others at their defaults:
Property Value (type value or select option as specified) Name vpc-subnet Region europe-west1IPv4 range 10.1.3.0/24 Flow Logs On Click Done, and then click Create.
Note: Turning on VPC flow logs doesn't affect performance, but some systems generate a large number of logs, which can increase costs.
Note: Wait for the network to be created before proceeding to the next step.
Test Completed Task
Click Check my progress to verify your performed task. If you have completed the task successfully you will granted with an assessment score.
Create the custom network.
Check my progress
Create a subnet for the custom network in europe-west1 region.
Check my progress
Create the firewall rule
In order to serve HTTP and SSH traffic on the network, you need to create a firewall rule.
In the left menu, click Firewall.
Click Create Firewall Rule.
Set the following values, leave all others at their defaults:
Property Value (type value or select option as specified) Name allow-http-ssh Network vpc-net Targets Specified target tags Target tags http-server Source filter IPv4 ranges Source IPv4 ranges 0.0.0.0/0 Protocols and ports Specified protocols and ports, and then check tcp, type: 80, 22
Note: Make sure to include the /0 in the Source IPv4 ranges to specify all networks.
- Click Create.
Test completed task
Click Check my progress to verify your performed task. If you have completed the task successfully you will granted with an assessment score.
Create the firewall rule in the custom network.
Check my progress
Task 2. Create an Apache web server
Create the web server
In the Cloud console, on the Navigation menu (☰), click Compute Engine > VM Instances, then click Create instance.
In the Machine configuration
Enter the values for the following fields:
Field Value Name web-serverRegion europe-west1Zone europe-west1-bSeries E2Machine Type e2-micro (2 vCPU, 1GB memory)Click Networking
Firewall: Allow HTTP traffic
Network interfaces : click on
defaultto edit.Network:
vpc-netSubnetwork:
vpc-subnet
Once all sections are configured, scroll down and click Create to launch your new virtual machine instance.
Wait a couple of minutes, you'll see a green check when the instance has launched.
Test completed task
Click Check my progress to verify your performed task. If you have completed the task successfully you will granted with an assessment score.
Create the web server in the custom network (zone:europe-west1-b).
Check my progress
Install Apache
Configure the VM instance that you created as an Apache webserver and overwrite the default web page.
Return to the Console, still on the VM instances page (Navigation menu (
) > Compute Engine > VM instances). For web-server, click SSH to launch a terminal and connect.
In the web-server SSH terminal, update the package index:

sudo apt-get update
- Install the Apache2 package:
sudo apt-get install apache2 -y
- Create a new default web page by overwriting the default:
echo '<!doctype html><html><body><h1>Hello World!</h1></body></html>' | sudo tee /var/www/html/index.html
- Exit the SSH terminal:
exit
Test completed task
Click Check my progress to verify your performed task. If you have completed the task successfully you will granted with an assessment score.
Install Apache in web server.
Check my progress
Task 3. Verify that network traffic is logged
Generate network traffic
Return to the Console, still on the VM instances page (Navigation menu (
) > Compute Engine > VM instances).
To view web-server, click the External IP to access the server.
Note: The Hello World! welcome page, which you configured, opens. Alternatively, you can access the server in a new tab by navigating to http://Enter the external IP Address.
Find your IP address
Find the IP address of the computer you are using. One easy way to do this is to go to a website that provides this address.
Click whatismyip.host to find your IP v4 address.
Copy your IP address. It will be referred to as
YOUR_IP_ADDRESS.
Access the VPC Flow Logs
In the Console, navigate to Navigation menu > View All Products > Logging > Logs Explorer.
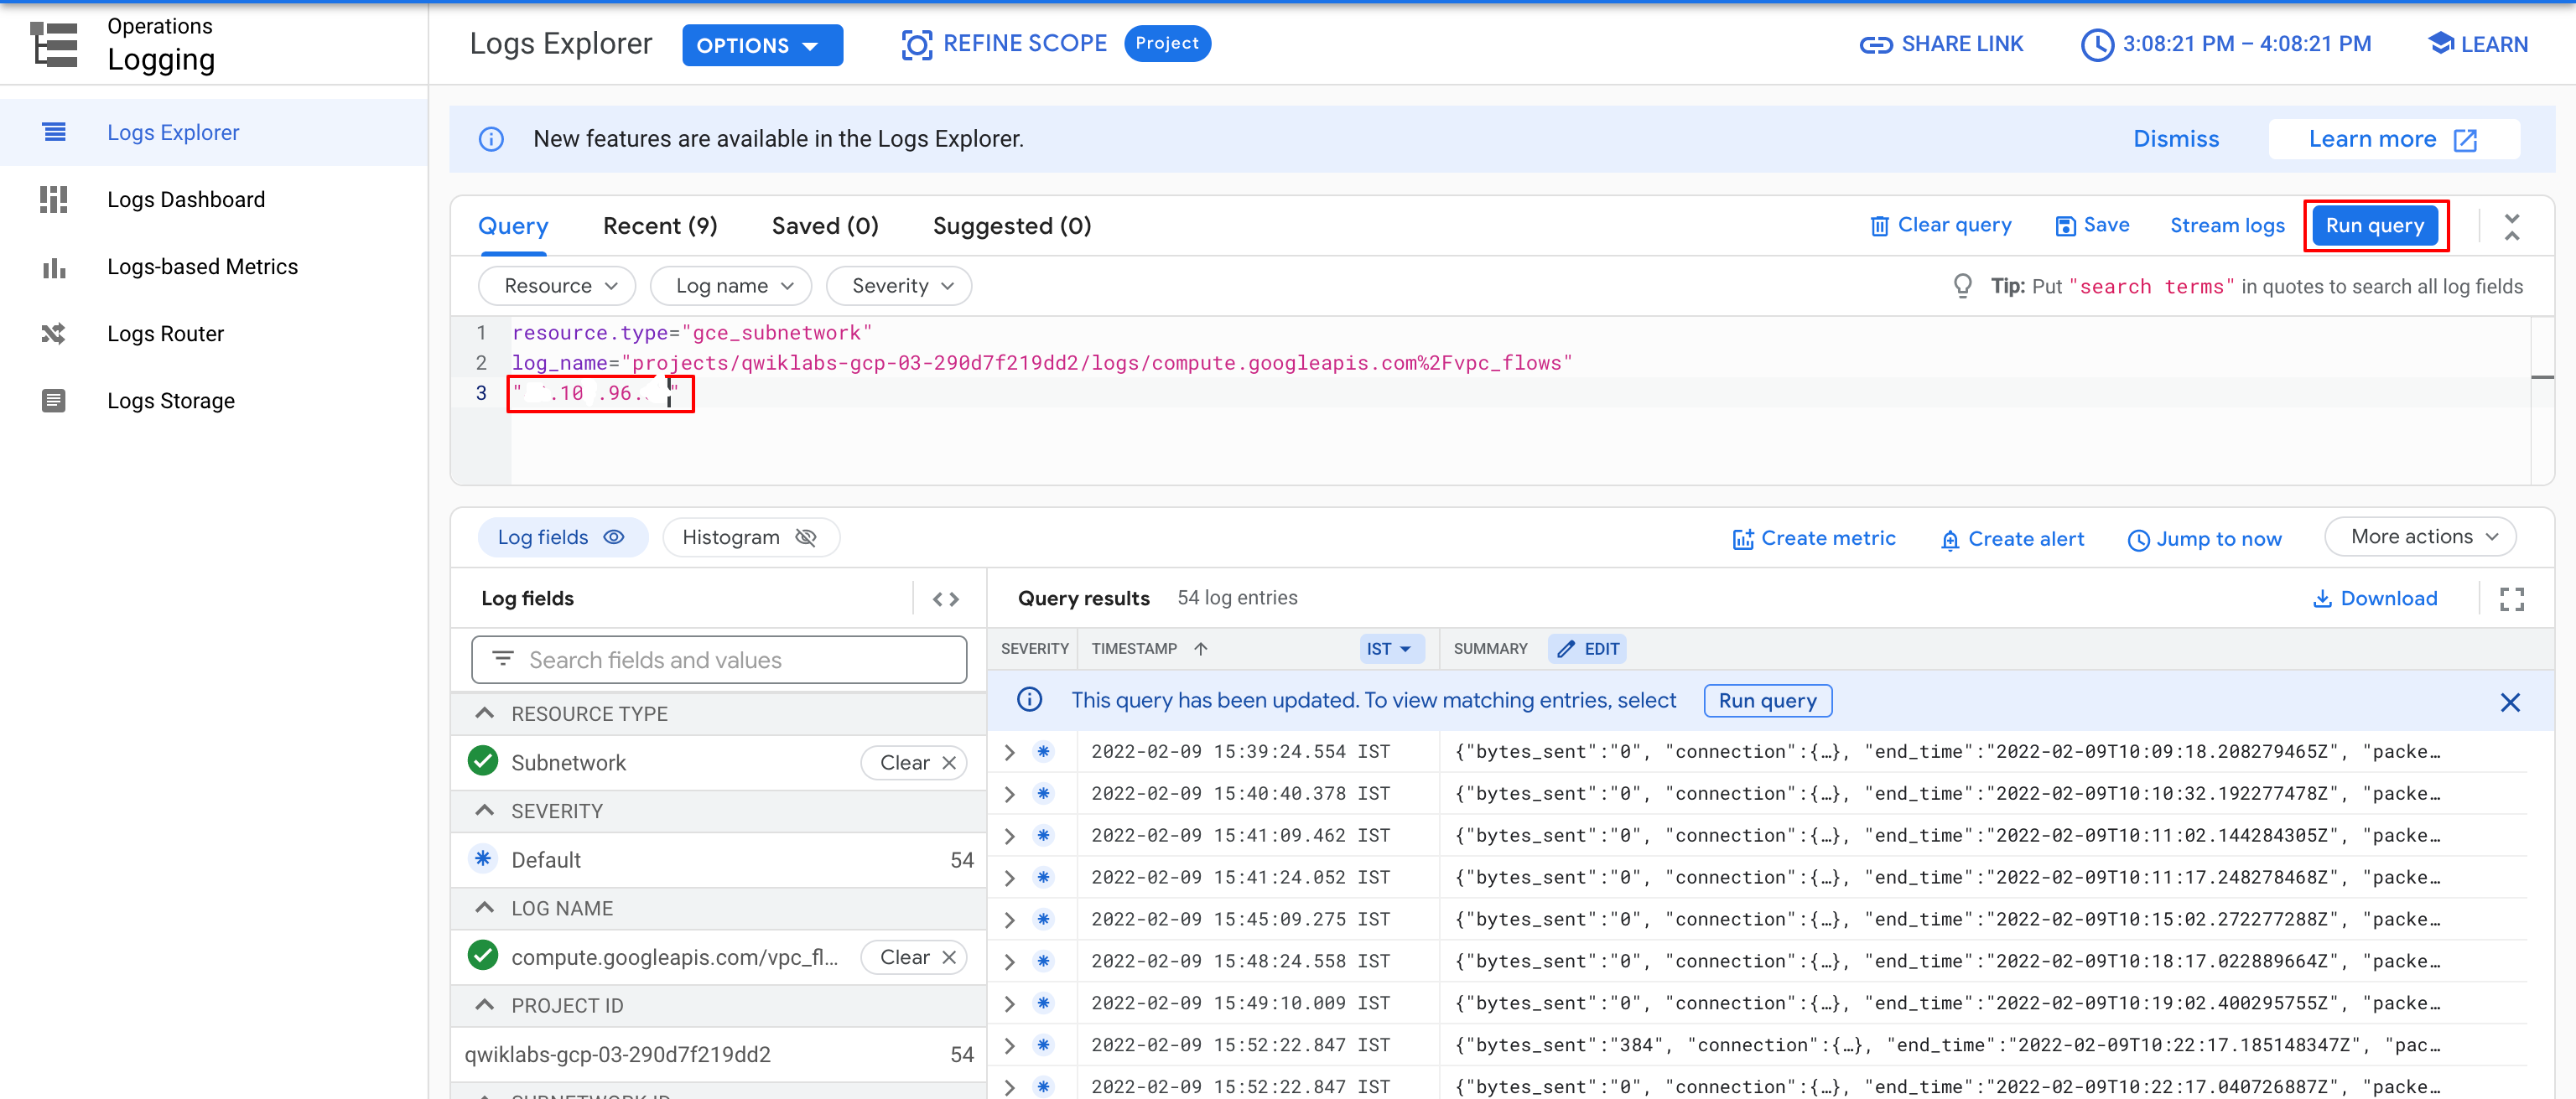
In the Log fields panel, under Resource type, click Subnetwork. In the Query results pane, entries from the subnetwork logs appear.
In the Log fields panel, under Log name, click compute.googleapis.com/vpc_flows.
Enter
"YOUR_IP_ADDRESS"in the Query search box at the top. Then Click Run Query.
Note: If you do not see the compute.googleapis.com/vpc_flows filter option or no logs, you might have to wait a couple of minutes and refresh.
Click on one of the log entries to expand it.
Within the entry, click the arrows to expand the jsonPayload and then the connection. You may have to click Expand all to see the connection.
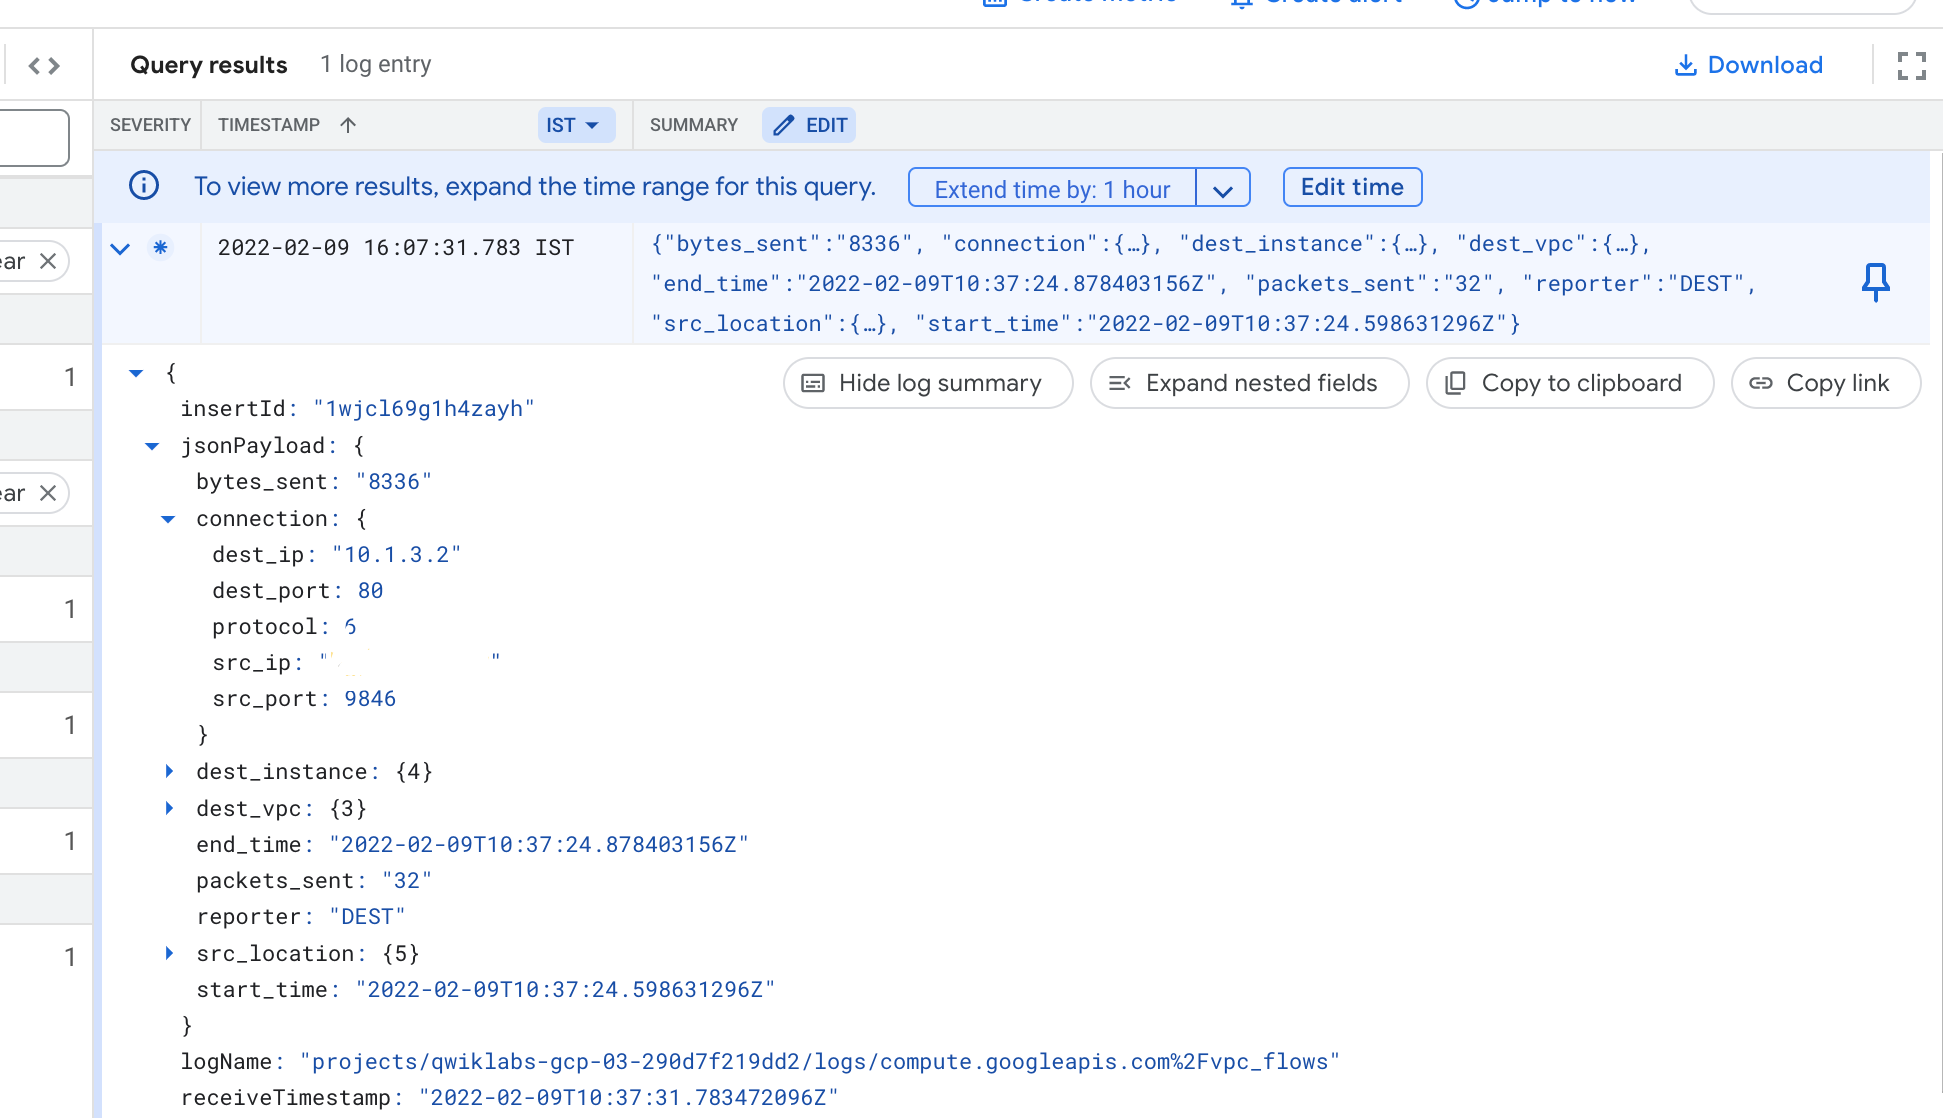
Note: The connection contains the destination IP address/port number, the protocol, and the source IP address/port number. Depending on the direction of the traffic, the destination is either your web-server or the machine you are working on and vice-versa for the source.
The protocol should be 6, which is the IANA protocol for TCP traffic. One of the port numbers will be 80, representing HTTP port on the web-server and the other port number should be a number greater than 1024, representing HTTP port on your machine.
Which fields does the connection contain?Source IP addressSource portDestination IP addressDestination portThe IANA protocol number
Submit
Feel free to explore other fields within the log entry before moving to the next task.
Task 4. Export the network traffic to BigQuery to further analyze the logs
Create an export sink
In the Console, in the left pane, click Logs Explorer.
From Resources dropdown, select Subnetwork. Then click Apply.
From Log name dropdown, check vpc_flows and click Apply. Then, click Run query.
Click More Actions > Create Sink.
For "Sink Name", type vpc-flows and click NEXT.
For "Select sink service", select the BigQuery dataset.
For "Sink Destination", select Create new BigQuery dataset.
For "Dataset ID", type bq_vpc_flows, and then click CREATE DATASET.
Click CREATE SINK. The Logs Router Sinks page appears. You should be able to see the sink you created (vpc-flows). If you are unable to see the sink click on Logs Router.
Generate log traffic for BigQuery
Now that the network traffic logs are exported to BigQuery, generate more traffic by accessing the web-server several times. Using Cloud Shell, you can curl the IP Address of the web-server several times.
In the Console, navigate to Navigation menu (
) > Compute Engine > VM instances.
Note the External IP address for the web-server instance to use in the next step. It will be referred to as
EXTERNAL_IP.In the Cloud Shell command line, run the following command to store the
EXTERNAL_IPin an environment variable. Replace the <EXTERNAL_IP> with the address you just noted:
export MY_SERVER=<EXTERNAL_IP>
- Access the web-server 50 times from Cloud Shell:
for ((i=1;i<=50;i++)); do curl $MY_SERVER; done
Test completed task
Click Check my progress to verify your performed task. If you have completed the task successfully you will granted with an assessment score.
Export the network traffic to BigQuery.
Check my progress
Visualize the VPC Flow Logs in BigQuery
In the Console, navigate to Navigation menu (
) > BigQuery.
Click Done.
On the left-hand side, expand the bq_vpc_flows dataset to reveal the table. You might have to first expand the Project ID to reveal the dataset.
Click on the name of the table. It should start with compute_googleapis.
Note: If you do not see the bq_vpc_flows dataset or it does not expand, wait and refresh the page.
Click on Details tab.
Copy the Table ID provided in the
Detailstab.Add the following to the Query Editor and replace your_table_id with
TABLE_IDwhile leaving the accents (`) on both sides:
#standardSQL
SELECT
jsonPayload.src_vpc.vpc_name,
SUM(CAST(jsonPayload.bytes_sent AS INT64)) AS bytes,
jsonPayload.src_vpc.subnetwork_name,
jsonPayload.connection.src_ip,
jsonPayload.connection.src_port,
jsonPayload.connection.dest_ip,
jsonPayload.connection.dest_port,
jsonPayload.connection.protocol
FROM
`your_table_id`
GROUP BY
jsonPayload.src_vpc.vpc_name,
jsonPayload.src_vpc.subnetwork_name,
jsonPayload.connection.src_ip,
jsonPayload.connection.src_port,
jsonPayload.connection.dest_ip,
jsonPayload.connection.dest_port,
jsonPayload.connection.protocol
ORDER BY
bytes DESC
LIMIT
15
- Click Run.
Note: The results table shows the total bytes sent, source IP address, destination IP address, destination port, protocol, and the respective vpc name and subnet name.
Note: If you get an error, ensure that you did not remove the #standardSQL part of the query. If it still fails, ensure that the TABLE_ID did not include the Project ID.with
Which columns do the results table contain?Source IP address and portDestination IP address and portProtocolVPC nameSubnet nameSum of bytes sent
Submit
Analyze the VPC Flow Logs in BigQuery
The previous query gave you the same information that you saw in the Cloud Console. Now change the query to identify the top IP addresses that have exchanged traffic with your web-server.
- Create a new query in the Query Editor with the following and replace your_table_id with
TABLE_IDwhile leaving the accents (`) on both sides:
#standardSQL
SELECT
jsonPayload.connection.src_ip,
jsonPayload.connection.dest_ip,
SUM(CAST(jsonPayload.bytes_sent AS INT64)) AS bytes,
jsonPayload.connection.dest_port,
jsonPayload.connection.protocol
FROM
`bq_vpc_flows.your_table_id`
WHERE jsonPayload.reporter = 'DEST'
GROUP BY
jsonPayload.connection.src_ip,
jsonPayload.connection.dest_ip,
jsonPayload.connection.dest_port,
jsonPayload.connection.protocol
ORDER BY
bytes DESC
LIMIT
15
- Click Run.
Note: The results table now has a row for each source IP and is sorted by the highest amount of bytes sent to the web-server. The top result should reflect your Cloud Shell IP address.
Note: Unless you accessed the web-server after creating the export sink, you will not see your machine's IP Address in the table.
Feel free to generate more traffic to the web-server from multiple sources and query the table again to determine the bytes sent to the server.
Task 5. Add VPC flow log aggregation
You will now explore a new release of VPC flow log volume reduction. Not every packet is captured into its own log record. However, even with sampling, log record captures can be quite large.
You can balance your traffic visibility and storage cost needs by adjusting specific aspects of logs collection, which you will explore in this section.
Setting up aggregation
In the Console, navigate to Navigation menu () > VPC network > VPC networks.
Click vpc-net, and then click Edit.
In the Subnets tab, click vpc-subnet:
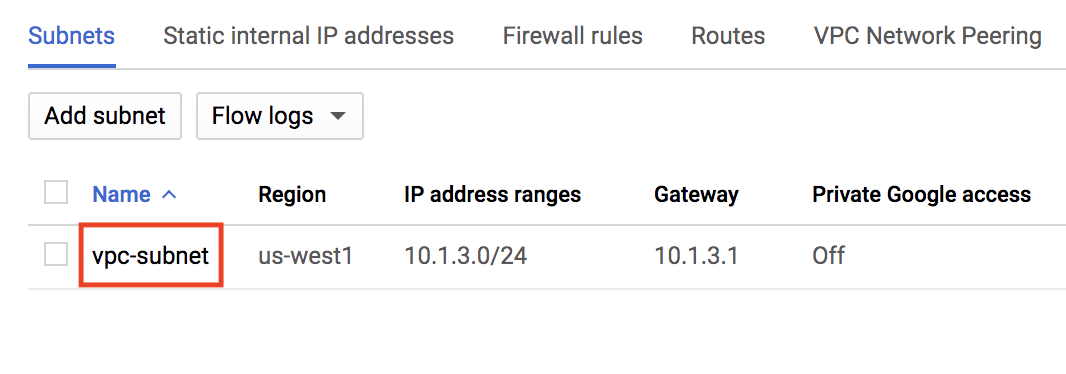
- Click Edit > Configure logs to expose the following fields:
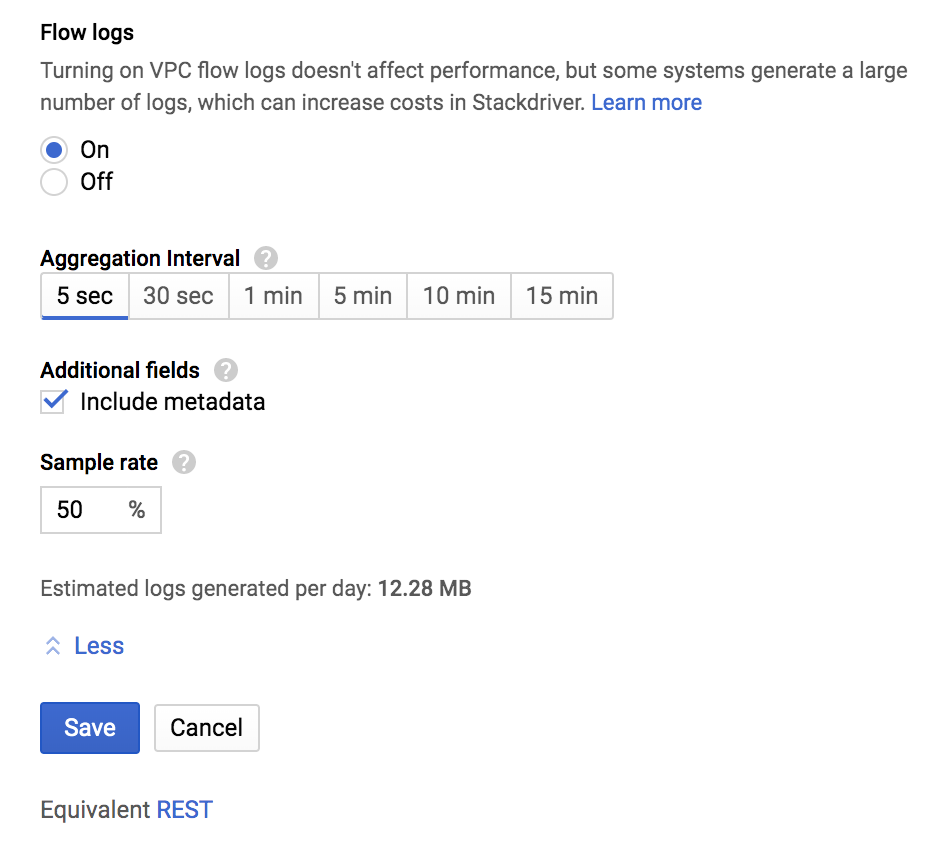
The purpose of each field is explained below:
Aggregation time interval: Sampled packets for a time interval are aggregated into a single log entry. This time interval can be 5 sec (default), 30 sec, 1 min, 5 min, 10 min, or 15 min.
Metadata annotations: By default, flow log entries are annotated with metadata information, such as the names of the source and destination VMs or the geographic region of external sources and destinations. This metadata annotation can be turned off to save storage space.
Log entry sampling: Before being written to the database, the number of logs can be sampled to reduce their number. By default, the log entry volume is scaled by 0.50 (50%), which means that half of entries are kept. You can set this from 1.0 (100%, all log entries are kept) to 0.0 (0%, no logs are kept).
Set the Aggregation Interval to 30 seconds.
Set the Sample rate to 25%.
Click Save. You should see the following message:
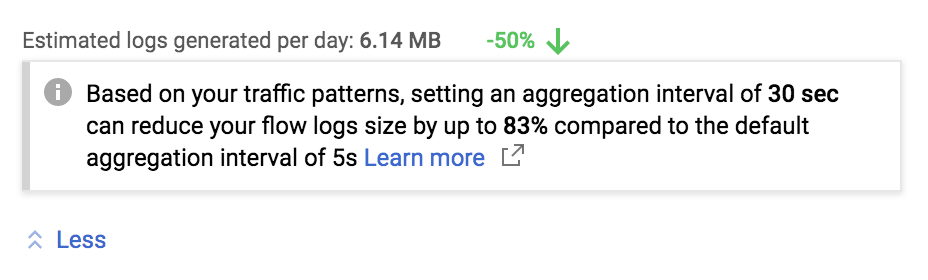
Setting the aggregation level to 30 seconds can reduce your flow logs size by up to 83% compared to the default aggregation interval of 5 seconds. Configuring your flow log aggregation can seriously affect your traffic visibility and storage costs.
Solution of Lab
🚨Copy and run the commands below in Cloud Shell:
curl -LO raw.githubusercontent.com/ePlus-DEV/storage/refs/heads/main/labs/GSP212/lab.sh
source lab.sh
Script Alternative
curl -LO raw.githubusercontent.com/prateekrajput08/Arcade-Google-Cloud-Labs/refs/heads/main/VPC%20Flow%20Logs%20-%20Analyzing%20Network%20Traffic/TechCode.sh
sudo chmod +x TechCode.sh
./TechCode.sh


Sink Name: vpc-flows
BigQuery dataset: bq_vpc_flows


CP_IP=\((gcloud compute instances describe web-server --zone=\)ZONE --format='get(networkInterfaces[0].accessConfigs[0].natIP)')

export MY_SERVER=$CP_IP

for ((i=1;i<=50;i++)); do curl $MY_SERVER; done