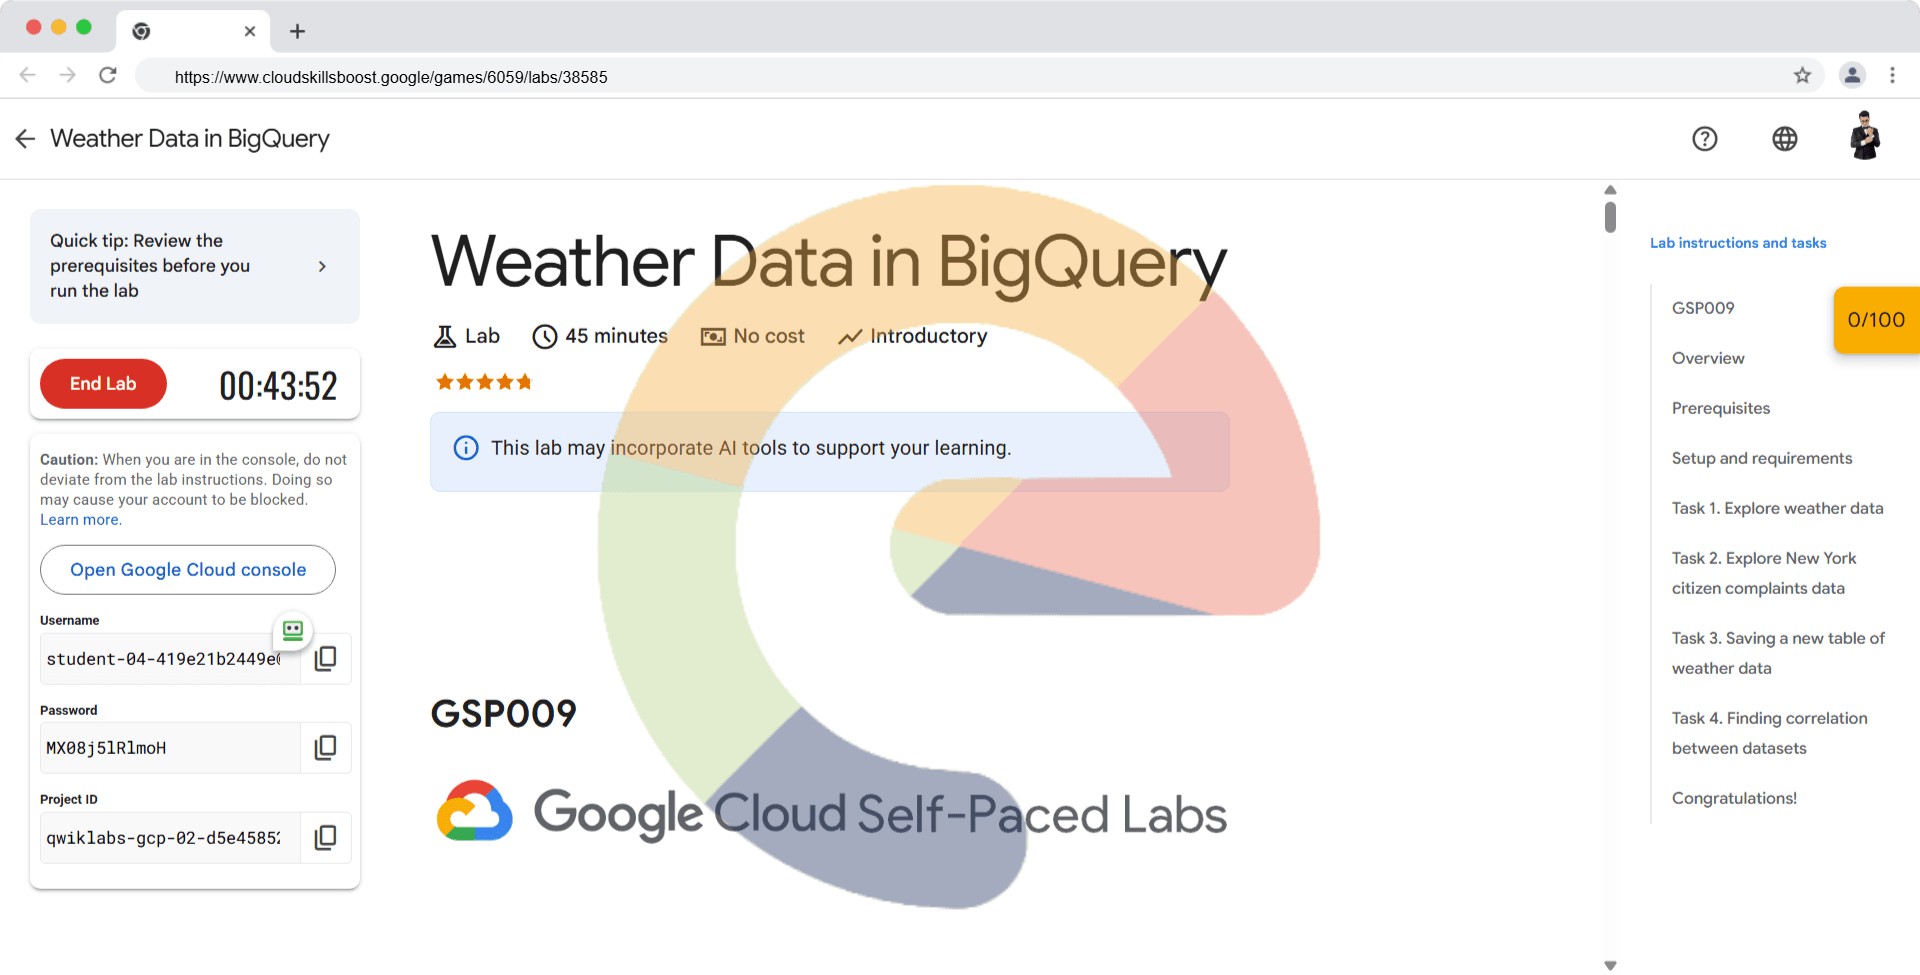
Weather Data in BigQuery - GSP009
A passionate full-stack developer from @ePlus.DEV
Overview
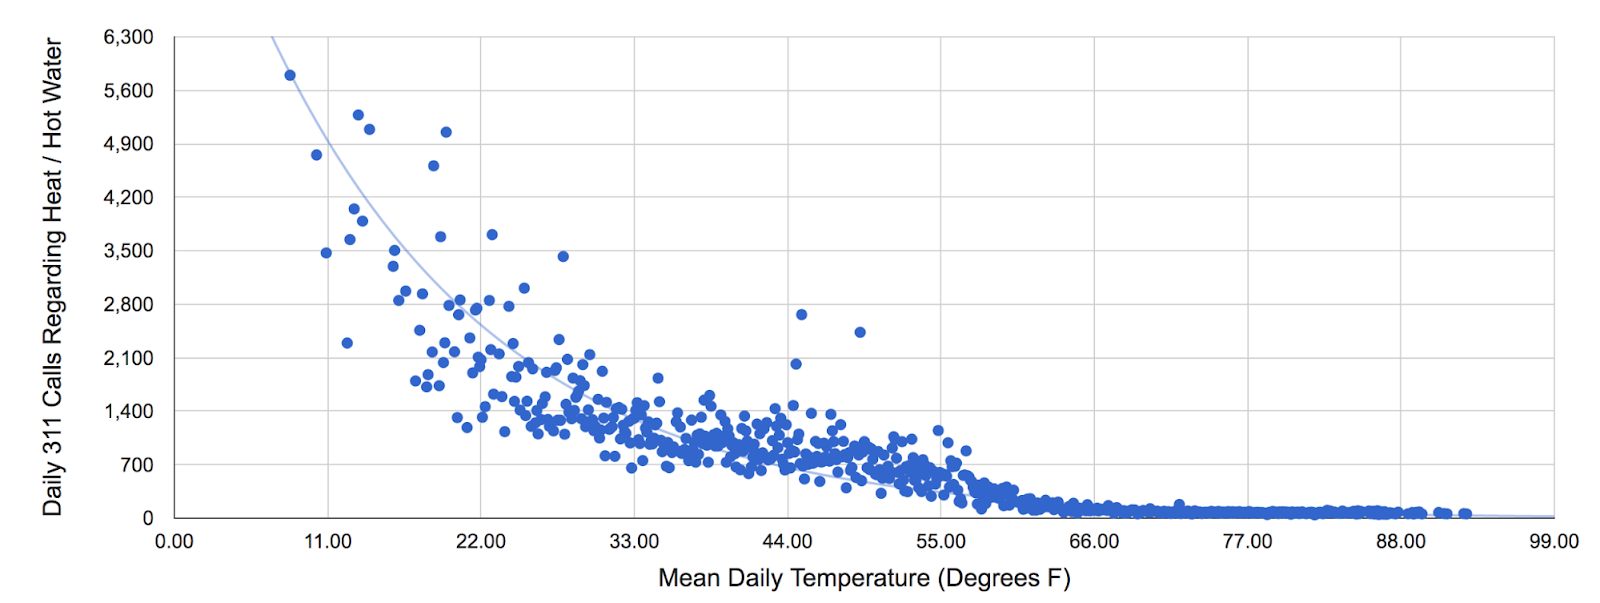
In this lab you will analyze historical weather observations from NOAA using BigQuery, then use the weather data in conjunction with citizen complaints to 311 in New York City - very similar to Reto Meier's blog post that demonstrates how data variables can correlate to each other.
You will try out several aspects of Google Cloud that are of great benefit to scientists:
Serverless. No need to download data to your machine in order to work with it - the dataset will remain on the cloud.
Ease of use. Run ad-hoc SQL queries on your dataset without having to prepare the data, like indexes, beforehand.
Scale. Carry out data exploration on extremely large datasets interactively. You don't need to sample the data in order to work with it in a timely manner.
Shareability. Run queries on data from different datasets without any issues. BigQuery is a convenient way to share datasets. Of course, you can also keep your data private, or share them only with specific persons -- not all data need to be public.
The end-result is that you will find what types of citizen complaints are correlated to weather. For example, you will find (not surprisingly) that complaints about residential furnaces are most common when it is cold outside.
What you'll learn
In this lab, you'll:
Carry out interactive queries on the BigQuery console.
Combine and run analytics on multiple datasets.
Use the
CORRfunction to determine positive, negative, or no correlation between datasets.
Prerequisites
This is a introductory level lab and assumes some experience with BigQuery and SQL. If you have never worked with BigQuery or MySQL, the BigQuery: Qwik Start - Console lab can get you up to speed with these Google Cloud services.
Setup and requirements
Before you click the Start Lab button
Read these instructions. Labs are timed and you cannot pause them. The timer, which starts when you click Start Lab, shows how long Google Cloud resources are made available to you.
This hands-on lab lets you do the lab activities in a real cloud environment, not in a simulation or demo environment. It does so by giving you new, temporary credentials you use to sign in and access Google Cloud for the duration of the lab.
To complete this lab, you need:
- Access to a standard internet browser (Chrome browser recommended).
Note: Use an Incognito (recommended) or private browser window to run this lab. This prevents conflicts between your personal account and the student account, which may cause extra charges incurred to your personal account.
- Time to complete the lab—remember, once you start, you cannot pause a lab.
Note: Use only the student account for this lab. If you use a different Google Cloud account, you may incur charges to that account.
How to start your lab and sign in to the Google Cloud console
Click the Start Lab button. If you need to pay for the lab, a dialog opens for you to select your payment method. On the left is the Lab Details pane with the following:
The Open Google Cloud console button
Time remaining
The temporary credentials that you must use for this lab
Other information, if needed, to step through this lab
Click Open Google Cloud console (or right-click and select Open Link in Incognito Window if you are running the Chrome browser).
The lab spins up resources, and then opens another tab that shows the Sign in page.
Tip: Arrange the tabs in separate windows, side-by-side.
Note: If you see the Choose an account dialog, click Use Another Account.
If necessary, copy the Username below and paste it into the Sign in dialog.
student-04-419e21b2449e@qwiklabs.netYou can also find the Username in the Lab Details pane.
Click Next.
Copy the Password below and paste it into the Welcome dialog.
MX08j5lRlmoHYou can also find the Password in the Lab Details pane.
Click Next.
Important: You must use the credentials the lab provides you. Do not use your Google Cloud account credentials.
Note: Using your own Google Cloud account for this lab may incur extra charges.
Click through the subsequent pages:
Accept the terms and conditions.
Do not add recovery options or two-factor authentication (because this is a temporary account).
Do not sign up for free trials.
After a few moments, the Google Cloud console opens in this tab.
Note: To access Google Cloud products and services, click the Navigation menu or type the service or product name in the Search field.

Task 1. Explore weather data
Open the BigQuery console
- In the Google Cloud Console, select Navigation menu > BigQuery.
The Welcome to BigQuery in the Cloud Console message box opens. This message box provides a link to the quickstart guide and the release notes.
- Click Done.
The BigQuery console opens.
- In the Explorer pane, click + ADD.
The Add data window opens.
Click Star a project by name under Additional sources.
Enter
bigquery-public-dataand click STAR.
In the BigQuery console you see two projects in the Explorer pane, one named your lab project ID, and one named bigquery-public-data.
In the Explorer pane of the BigQuery console, expand bigquery-public-data dataset. In the Type to search field search for noaa_gsod and select the gsod2014 table.
In the Table (gsod2014) window, click the Preview tab.
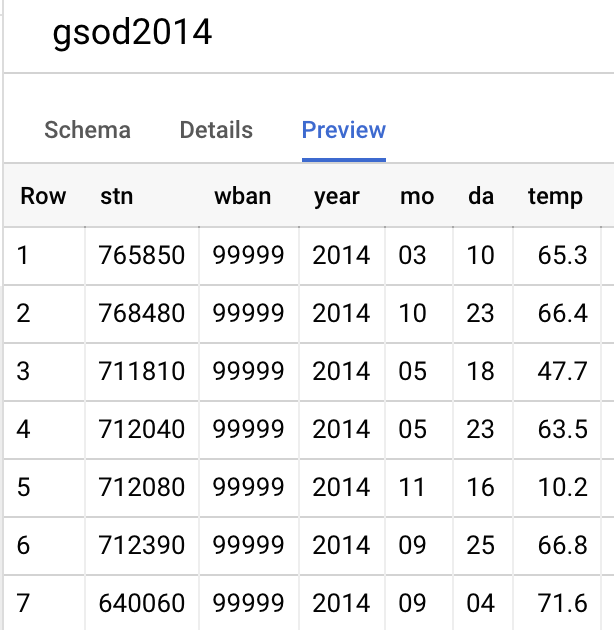
Examine the columns and some of the data values.
Click Query > In new tab then paste the following query:
SELECT
  -- Create a timestamp from the date components.
  stn,
  TIMESTAMP(CONCAT(year,"-",mo,"-",da)) AS timestamp,
  -- Replace numerical null values with actual null
  AVG(IF (temp=9999.9,
      null,
      temp)) AS temperature,
  AVG(IF (wdsp="999.9",
      null,
      CAST(wdsp AS Float64))) AS wind_speed,
  AVG(IF (prcp=99.99,
      0,
      prcp)) AS precipitation
FROM
  `bigquery-public-data.noaa_gsod.gsod20*`
WHERE
  CAST(YEAR AS INT64) > 2010
  AND CAST(MO AS INT64) = 6
  AND CAST(DA AS INT64) = 12
  AND (stn="725030" OR  -- La Guardia
    stn="744860")    -- JFK
GROUP BY
  stn,
  timestamp
ORDER BY
  timestamp DESC,
  stn ASC
- Click RUN. Look at the result and try to determine what this query does.
Click Check my progress below to verify you're on track in this lab.
Explore weather data
Check my progress
Task 2. Explore New York citizen complaints data
In the Explorer pane of the BigQuery Console, select the newly added bigquery-public-data project, in the Type to search field search for the new_york_311 dataset, then select 311_service_requests table.
Then click on the Preview tab. Your console should resemble the following:
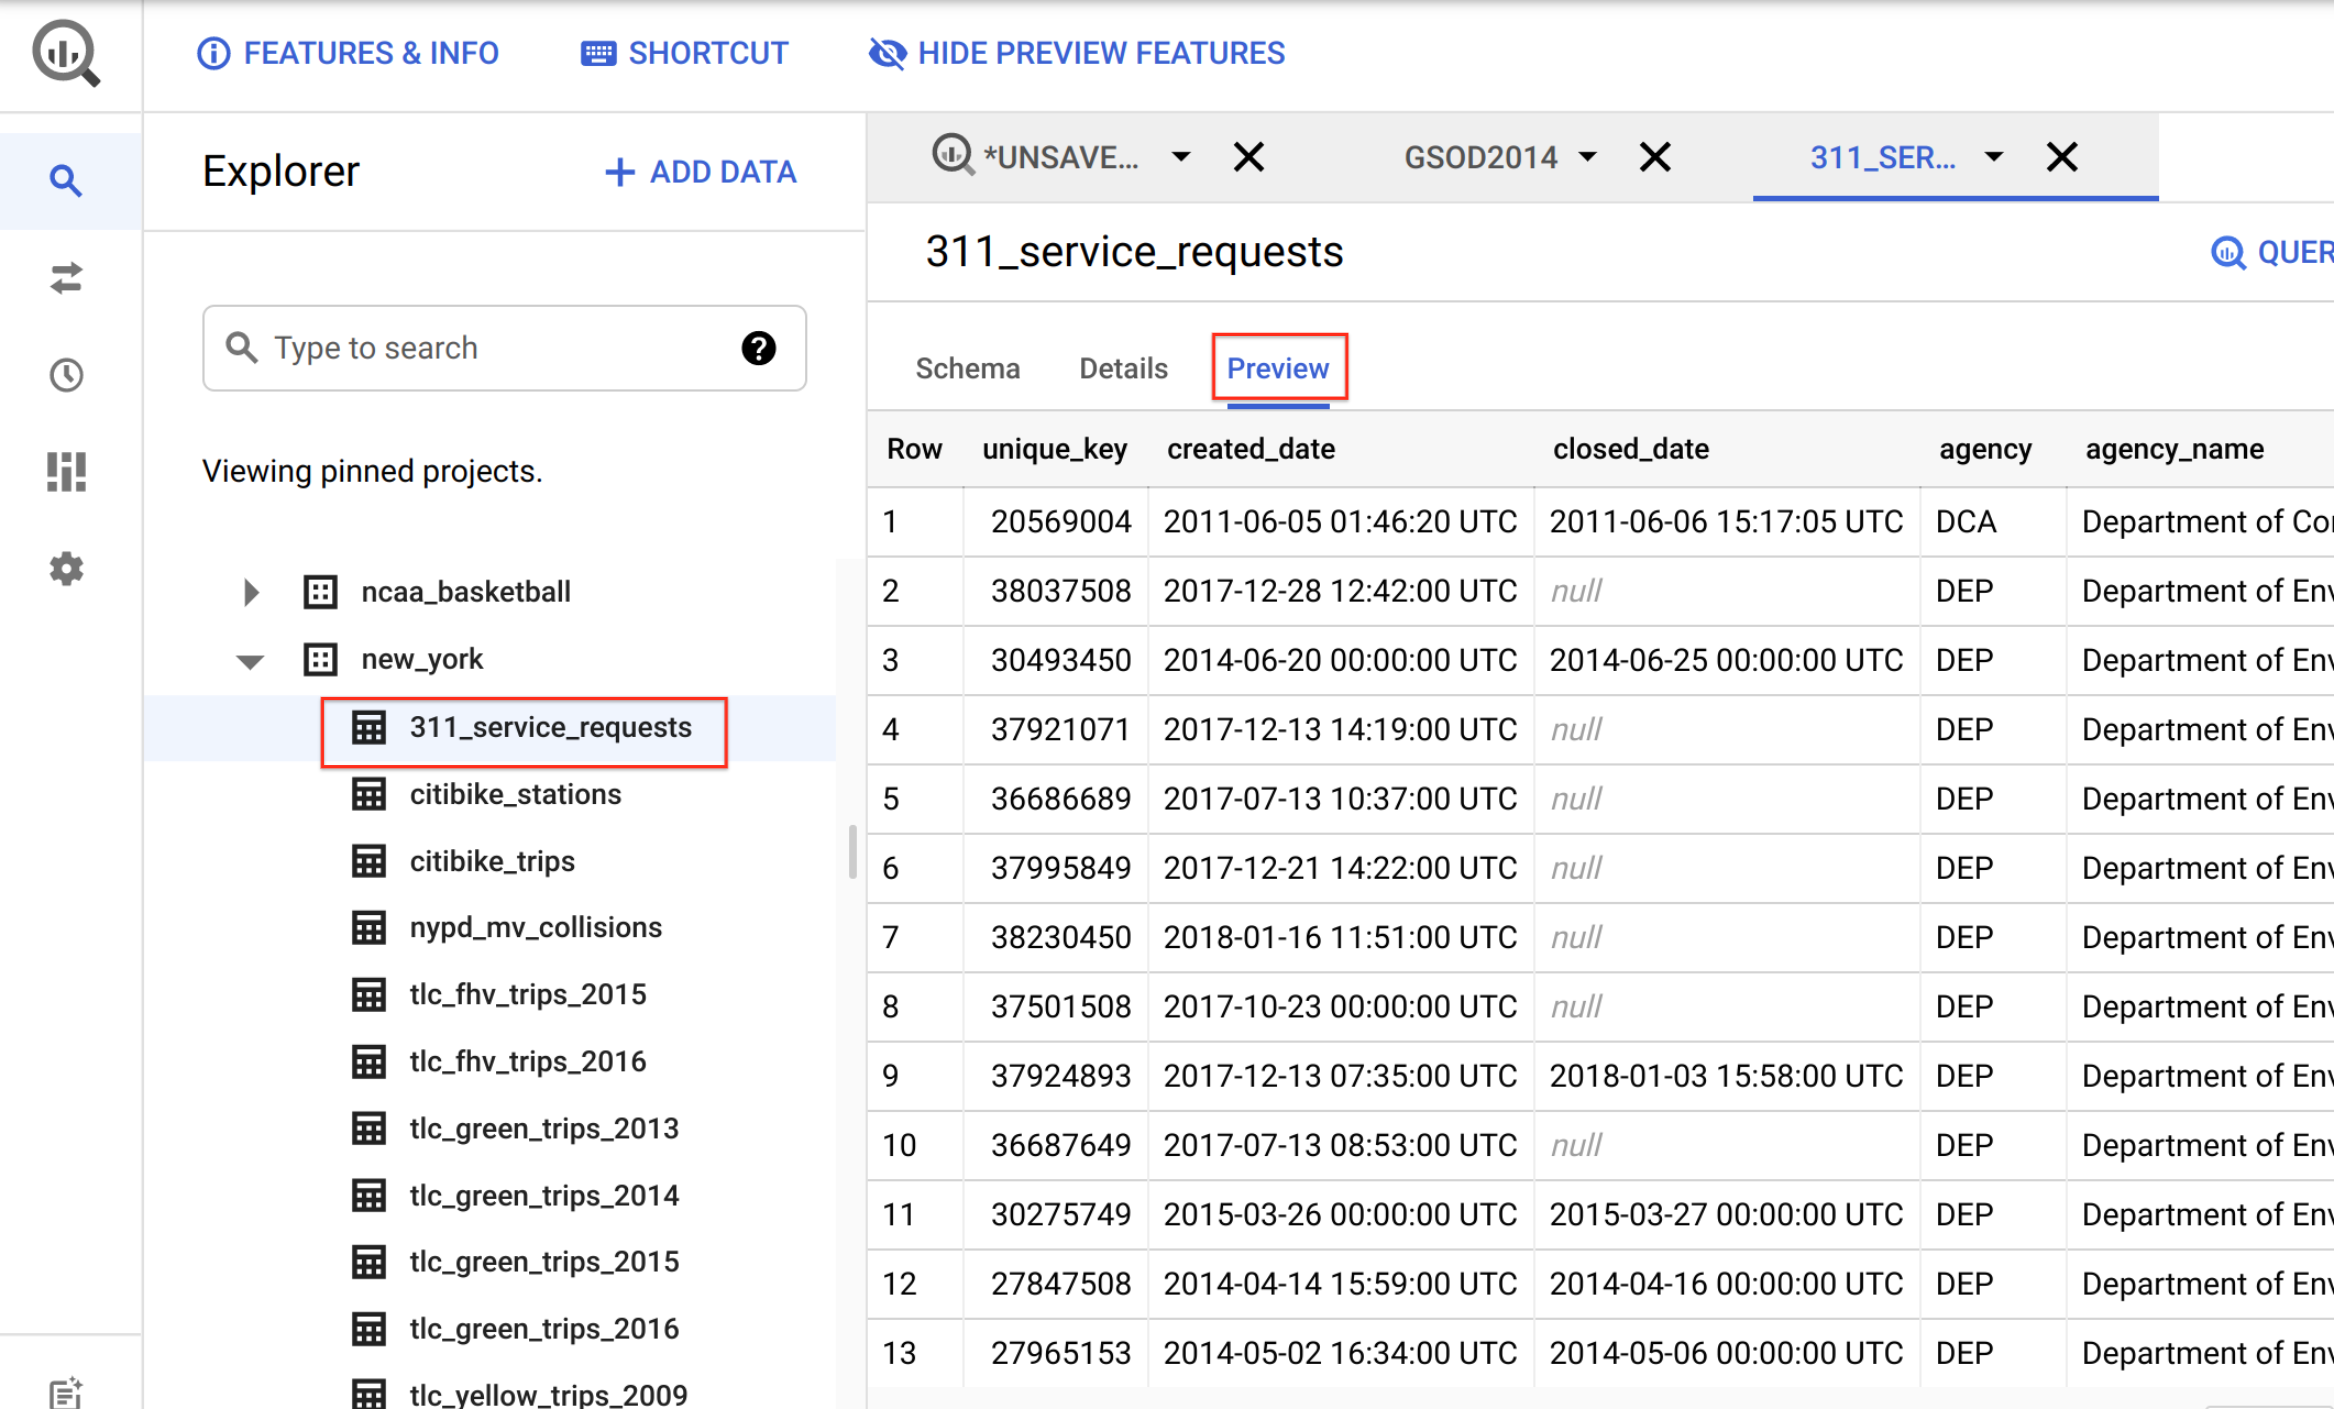
Examine the columns and some of the data values.
If the editor has been closed, click "+" (Create SQL query) icon.
Paste the following into the query EDITOR:
SELECT
  EXTRACT(YEAR
  FROM
    created_date) AS year,
  complaint_type,
  COUNT(1) AS num_complaints
FROM
  `bigquery-public-data.new_york.311_service_requests`
GROUP BY
  year,
  complaint_type
ORDER BY
  num_complaints DESC
Click RUN.
Look at the results to determine what the most common complaints are. You will try to determine if these complaints correlate to weather in a later part of this lab.
Click Check my progress below to verify you're on track in this lab.
Explore New York citizen complaints data
Check my progress
Task 3. Saving a new table of weather data
In the Explorer pane of the BigQuery Console, click on the three dots next to your
Project IDand then select Create dataset.In the Create dataset dialog, set the Dataset ID to
demosand leave the other options at their default values.Click Create dataset. Your project now has a dataset named
demos.Click "+" (Create SQL query) icon and then run the following query:
SELECT
  -- Create a timestamp from the date components.
  timestamp(concat(year,"-",mo,"-",da)) as timestamp,
  -- Replace numerical null values with actual nulls
  AVG(IF (temp=9999.9, null, temp)) AS temperature,
  AVG(IF (visib=999.9, null, visib)) AS visibility,
  AVG(IF (wdsp="999.9", null, CAST(wdsp AS Float64))) AS wind_speed,
  AVG(IF (gust=999.9, null, gust)) AS wind_gust,
  AVG(IF (prcp=99.99, null, prcp)) AS precipitation,
  AVG(IF (sndp=999.9, null, sndp)) AS snow_depth
FROM
  `bigquery-public-data.noaa_gsod.gsod20*`
WHERE
  CAST(YEAR AS INT64) > 2008
  AND (stn="725030" OR  -- La Guardia
       stn="744860")    -- JFK
GROUP BY timestamp
In the query EDITOR section, click More > Query settings.
In the Query settings dialog, set the following fields. Leave all others at their default value.
Destination: select Set a destination table for query results
Dataset: Type demos and select your dataset.
Table Id: Type nyc_weather
Results size: check Allow large results (no size limit)
Click SAVE
Click RUN.
The results are now saved in the dataset you created (demos).
Navigate back to More > Query settings and, in the Destination option select Save query results in a temporary table. This removes the demos dataset as a destination for future queries.
Click SAVE to close the query settings.
Click Check my progress below to verify you're on track in this lab.
Saving a new table of weather data
Check my progress
Task 4. Finding correlation between datasets
Strong correlation, as measured by the CORR function, indicates a close and consistent relationship between two variables. As the value of one variable increases, the value of the other variable also tends to increase (positive correlation) or decrease (negative correlation) in a predictable way. Strong correlation is generally considered to be a value greater than or equal to 0.7, in absolute terms. This means that the changes in one variable can explain at least 49% of the changes in the other variable.
Next you will compare the number of complaints received and daily temperature using the CORR function.
- Create SQL query, "+", and run the following query:
SELECT
  descriptor,
  sum(complaint_count) as total_complaint_count,
  count(temperature) as data_count,
  ROUND(corr(temperature, avg_count),3) AS corr_count,
  ROUND(corr(temperature, avg_pct_count),3) AS corr_pct
From (
SELECT
  avg(pct_count) as avg_pct_count,
  avg(day_count) as avg_count,
  sum(day_count) as complaint_count,
  descriptor,
  temperature
FROM (
  SELECT
    DATE(timestamp) AS date,
    temperature
  FROM
    demos.nyc_weather) a
  JOIN (
  SELECT x.date, descriptor, day_count, day_count / all_calls_count as pct_count
  FROM
    (SELECT
      DATE(created_date) AS date,
      concat(complaint_type, ": ", descriptor) as descriptor,
      COUNT(*) AS day_count
    FROM
      `bigquery-public-data.new_york.311_service_requests`
    GROUP BY
      date,
      descriptor)x
    JOIN (
      SELECT
        DATE(timestamp) AS date,
        COUNT(*) AS all_calls_count
      FROM `demos.nyc_weather`
      GROUP BY date
    )y
  ON x.date=y.date
)b
ON
  a.date = b.date
GROUP BY
  descriptor,
  temperature
)
GROUP BY descriptor
HAVING
  total_complaint_count > 5000 AND
  ABS(corr_pct) > 0.5 AND
  data_count > 5
ORDER BY
  ABS(corr_pct) DESC
The results indicate that Heating complaints are negatively correlated with temperature (i.e., more heating calls on cold days) and calls about dead trees are positively correlated with temperature (i.e., more calls on hot days).
Next, compare the number of complaints and wind speed with the CORR function.
- Click "+" (Create SQL query) icon and run the following query:
SELECT
  descriptor,
  sum(complaint_count) as total_complaint_count,
  count(wind_speed) as data_count,
  ROUND(corr(wind_speed, avg_count),3) AS corr_count,
  ROUND(corr(wind_speed, avg_pct_count),3) AS corr_pct
From (
SELECT
  avg(pct_count) as avg_pct_count,
  avg(day_count) as avg_count,
  sum(day_count) as complaint_count,
  descriptor,
  wind_speed
FROM (
  SELECT
    DATE(timestamp) AS date,
    wind_speed
  FROM
    demos.nyc_weather) a
  JOIN (
  SELECT x.date, descriptor, day_count, day_count / all_calls_count as pct_count
  FROM
    (SELECT
      DATE(created_date) AS date,
      concat(complaint_type, ": ", descriptor) as descriptor,
      COUNT(*) AS day_count
    FROM
      `bigquery-public-data.new_york.311_service_requests`
    GROUP BY
      date,
      descriptor)x
    JOIN (
      SELECT
        DATE(timestamp) AS date,
        COUNT(*) AS all_calls_count
      FROM `demos.nyc_weather`
      GROUP BY date
    )y
  ON x.date=y.date
)b
ON
  a.date = b.date
GROUP BY
  descriptor,
  wind_speed
)
GROUP BY descriptor
HAVING
  total_complaint_count > 5000 AND
  ABS(corr_pct) > 0.5 AND
  data_count > 5
ORDER BY
  ABS(corr_pct) DESC
- Notice that the Corr columns are both negative for noise related complaints — Do you have a hypothesis for why noise complaints reduce on windy days? Are the coefficients statistically sufficient?
Click Check my progress below to verify you're on track in this lab.
Find correlation between weather and complaints
Solution of Lab
curl -LO raw.githubusercontent.com/quiccklabs/Labs_solutions/master/Weather%20Data%20in%20BigQuery/quicklabgsp009.sh
sudo chmod +x quicklabgsp009.sh
./quicklabgsp009.sh