Using Cloud Trace on Kubernetes Engine - GSP484
A passionate full-stack developer from @ePlus.DEV
Overview
When supporting a production system that services HTTP requests or provides an API, it is important to measure the latency of your endpoints to detect when a system's performance is not operating within specification. In monolithic systems this single latency measure may be useful to detect and diagnose deteriorating behavior. With modern microservice architectures, however, this becomes much more difficult because a single request may result in numerous additional requests to other systems before the request can be fully handled.
Deteriorating performance in an underlying system may impact all other systems that rely on it. While latency can be measured at each service endpoint, it can be difficult to correlate slow behavior in the public endpoint with a particular sub-service that is misbehaving.
Enter distributed tracing. Distributed tracing uses metadata passed along with requests to correlate requests across service tiers. By collecting telemetry data from all the services in a microservice architecture and propagating a trace id from an initial request to all subsidiary requests, developers can much more easily identify which service is causing slowdowns affecting the rest of the system.
Google Cloud provides the Operations suite of products to handle logging, monitoring, and distributed tracing. This lab will be deployed to Kubernetes Engine and will demonstrate a multi-tier architecture implementing distributed tracing. It will also take advantage of Terraform to build out necessary infrastructure.
This lab was created by GKE Helmsman engineers to give you a better understanding of GKE Binary Authorization. You can view this demo by running gsutil cp -r gs://spls/gke-binary-auth/* . and cd gke-binary-auth-demo command in cloud shell. We encourage any and all to contribute to our assets!
Setup and requirements
Before you click the Start Lab button
Read these instructions. Labs are timed and you cannot pause them. The timer, which starts when you click Start Lab, shows how long Google Cloud resources are made available to you.
This hands-on lab lets you do the lab activities in a real cloud environment, not in a simulation or demo environment. It does so by giving you new, temporary credentials you use to sign in and access Google Cloud for the duration of the lab.
To complete this lab, you need:
- Access to a standard internet browser (Chrome browser recommended).
Note: Use an Incognito (recommended) or private browser window to run this lab. This prevents conflicts between your personal account and the student account, which may cause extra charges incurred to your personal account.
- Time to complete the lab—remember, once you start, you cannot pause a lab.
Note: Use only the student account for this lab. If you use a different Google Cloud account, you may incur charges to that account.
How to start your lab and sign in to the Google Cloud console
Click the Start Lab button. If you need to pay for the lab, a dialog opens for you to select your payment method. On the left is the Lab Details pane with the following:
The Open Google Cloud console button
Time remaining
The temporary credentials that you must use for this lab
Other information, if needed, to step through this lab
Click Open Google Cloud console (or right-click and select Open Link in Incognito Window if you are running the Chrome browser).
The lab spins up resources, and then opens another tab that shows the Sign in page.
Tip: Arrange the tabs in separate windows, side-by-side.
Note: If you see the Choose an account dialog, click Use Another Account.
If necessary, copy the Username below and paste it into the Sign in dialog.
student-04-20fbea6137a2@qwiklabs.netCopied!
You can also find the Username in the Lab Details pane.
Click Next.
Copy the Password below and paste it into the Welcome dialog.
vGCaxTeSxpgNCopied!
You can also find the Password in the Lab Details pane.
Click Next.
Important: You must use the credentials the lab provides you. Do not use your Google Cloud account credentials.
Note: Using your own Google Cloud account for this lab may incur extra charges.
Click through the subsequent pages:
Accept the terms and conditions.
Do not add recovery options or two-factor authentication (because this is a temporary account).
Do not sign up for free trials.
After a few moments, the Google Cloud console opens in this tab.
Note: To access Google Cloud products and services, click the Navigation menu or type the service or product name in the Search field.

Activate Cloud Shell
Cloud Shell is a virtual machine that is loaded with development tools. It offers a persistent 5GB home directory and runs on the Google Cloud. Cloud Shell provides command-line access to your Google Cloud resources.
Click Activate Cloud Shell
at the top of the Google Cloud console.
Click through the following windows:
Continue through the Cloud Shell information window.
Authorize Cloud Shell to use your credentials to make Google Cloud API calls.

When you are connected, you are already authenticated, and the project is set to your Project_ID, qwiklabs-gcp-00-86734d2ce627. The output contains a line that declares the Project_ID for this session:
Your Cloud Platform project in this session is set to qwiklabs-gcp-00-86734d2ce627
gcloud is the command-line tool for Google Cloud. It comes pre-installed on Cloud Shell and supports tab-completion.
- (Optional) You can list the active account name with this command:
gcloud auth list
Copied!
- Click Authorize.
Output:
ACTIVE: *
ACCOUNT: student-04-20fbea6137a2@qwiklabs.net

To set the active account, run:
    $ gcloud config set account `ACCOUNT`
- (Optional) You can list the project ID with this command:
gcloud config list project
Copied!
Output:
[core]
project = qwiklabs-gcp-00-86734d2ce627
Note: For full documentation of gcloud, in Google Cloud, refer to the gcloud CLI overview guide.
Clone demo
- Clone the resources needed for this lab by running:
git clone https://github.com/GoogleCloudPlatform/gke-tracing-demo
Copied!
- Go into the directory for this demo:
cd gke-tracing-demo
Copied!
Set your region and zone
Certain Compute Engine resources live in regions and zones. A region is a specific geographical location where you can run your resources. Each region has one or more zones.
Note: Learn more about regions and zones and see a complete list in Regions & Zones documentation.
Run the following to set a region and zone for your lab (you can use the region/zone that's best for you):
gcloud config set compute/region us-central1
gcloud config set compute/zone us-central1-f
Copied!
Architecture
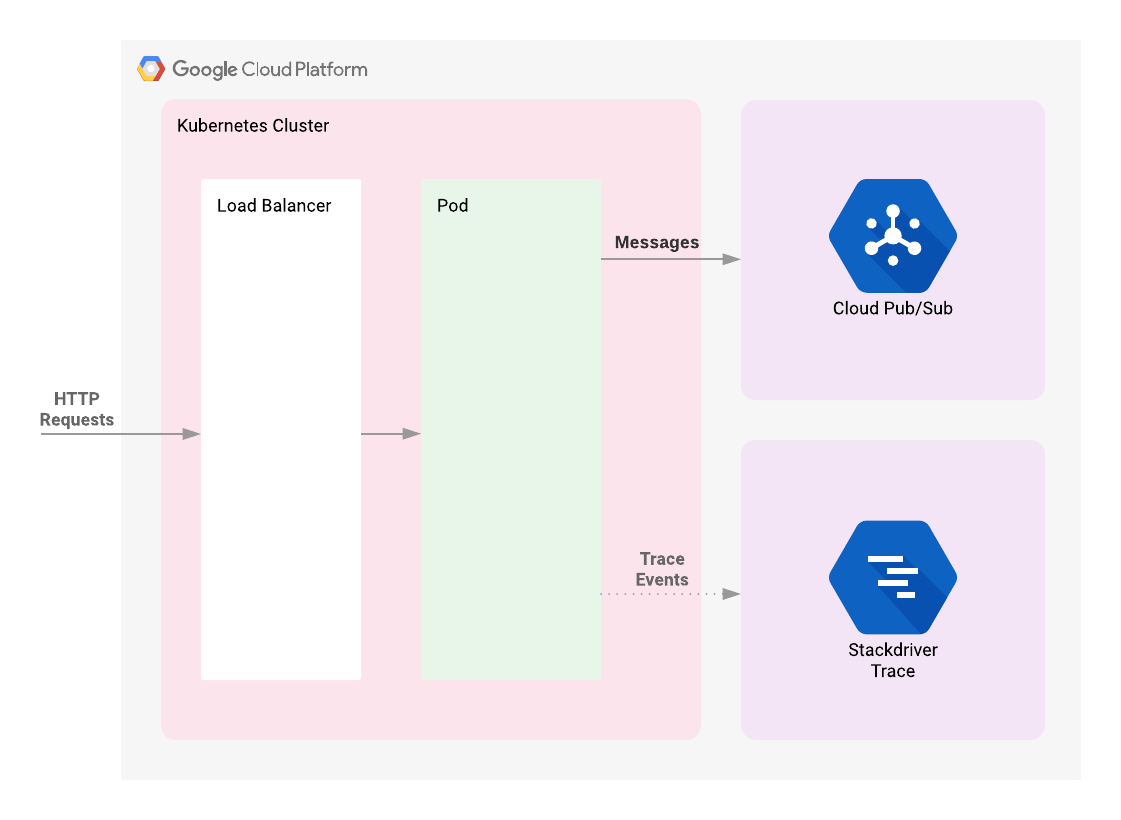
The lab begins by deploying a Kubernetes Engine cluster. To this cluster will be deployed a simple web application fronted by a load balancer. The web app will publish messages provided by the user to a Cloud Pub/Sub topic. The application is instrumented such that HTTP requests to it will result in the creation of a trace whose context will be propagated to the Cloud Pub/Sub publish API request. The correlated telemetry data from these requests will be available in the Cloud Trace Console.
Introduction to Terraform
Following the principles of infrastructure as code and immutable infrastructure, Terraform supports the writing of declarative descriptions of the desired state of infrastructure. When the descriptor is applied, Terraform uses Google Cloud APIs to provision and update resources to match. Terraform compares the desired state with the current state so incremental changes can be made without deleting everything and starting over. For instance, Terraform can build out Google Cloud projects and compute instances, etc., even set up a Kubernetes Engine cluster and deploy applications to it. When requirements change, the descriptor can be updated and Terraform will adjust the cloud infrastructure accordingly.
This example will start up a Kubernetes Engine cluster using Terraform. Then you will use Kubernetes commands to deploy a demo application to the cluster. By default, Kubernetes Engine clusters in Google Cloud are launched with a pre-configured Fluentd-based collector that forwards logging events for the cluster to Cloud Monitoring. Interacting with the demo app will produce trace events that are visible in the Cloud Trace UI.
Running Terraform
There are three Terraform files provided with this demo, located in the /terraform subdirectory of the project. The first one, main.tf, is the starting point for Terraform. It describes the features that will be used, the resources that will be manipulated, and the outputs that will result. The second file is provider.tf, which indicates which cloud provider and version will be the target of the Terraform commands--in this case Google Cloud. The final file is variables.tf, which contains a list of variables that are used as inputs into Terraform. Any variables referenced in the main.tf that do not have defaults configured in variables.tf will result in prompts to the user at runtime.
Task 1. Initialization
Given that authentication was configured above, you are now ready to deploy the infrastructure.
- Run the following command from the root directory of the project:
cd terraform
Copied!
Update the provider.tf file
Remove the provider version for the Terraform from the provider.tf script file.
- Edit the
provider.tfscript file:
nano provider.tf
Copied!
terraform {
  required_providers {
    google = {
      source = "hashicorp/google"
      version = "3.84.0"
    }
  }
}
provider "google" {
  project = var.project
}
Copied!
- Then save the file with CTRL + X > Y > Enter.
After modification your provider.tf script file should look like:
...
provider "google" {
  project = var.project
}
From here, initialize Terraform.
- Enter:
terraform init
Copied!
This will download the dependencies that Terraform requires: the Google Cloud project and the Google Cloud zone to which the demo application should be deployed. Terraform will prompt for these values if it does not know them already. By default, it will look for a file called terraform.tfvars or files with a suffix of .auto.tfvars in the current directory to obtain those values.
This demo provides a convenience script to prompt for project and zone and persist them in a terraform.tfvars file.
- Run:
../scripts/generate-tfvars.sh
Copied!
Note: If the file already exists you will receive an error.
The script uses previously-configured values from the gcloud command. If they have not been configured, the error message will indicate how they should be set. The existing values can be viewed with the following command:
gcloud config list
Copied!
- If the displayed values don't correspond to where you intend to run the demo application, change the values in
terraform.tfvarsto your preferred values.
Task 2. Deployment
- Having initialized Terraform you can see the work that Terraform will perform with the following command:
terraform plan
Copied!
This command can be used to visually verify that settings are correct and Terraform will inform you if it detects any errors. While not necessary, it is a good practice to run it every time prior to changing infrastructure using Terraform.
- After verification, tell Terraform to set up the necessary infrastructure:
terraform apply
Copied!
The changes that will be made are displayed, and asks you to confirm with yes.
Note: If you get deprecation warnings related to the zone variable, please ignore it and move forward in the lab.
While you're waiting for your build to complete, set up a Cloud Monitoring workspace to be used later in the lab.
Test completed task
Click Check my progress to verify your performed task. If you have successfully deployed necessary infrastructure with Terraform, you will see an assessment score.
Use Terraform to set up the necessary infrastructure
Create a Monitoring Metrics Scope
Set up a Monitoring Metrics Scope that's tied to your Google Cloud Project. The following steps create a new account that has a free trial of Monitoring.
In the Cloud Console, click Navigation menu (
) > View All Products > Observability > Monitoring.

When the Monitoring Overview page opens, your metrics scope project is ready.
Task 3. Deploy demo application
Back in Cloud Shell, after you see the
Apply complete!message, return to the Console.In the Navigation menu, go to Kubernetes Engine > Clusters to see your cluster.
Click on Navigation menu, click on view all products then scroll down to the Analytics section and click on Pub/Sub to see the Topics and Subscriptions.
Now, deploy the demo application using Kubernetes's
kubectlcommand:
kubectl apply -f tracing-demo-deployment.yaml
Copied!
Once the app has been deployed, it can be viewed in the Kubernetes Engine > Workloads. You can also see the load balancer that was created for the application in the Gateways, Services & Ingress > Services section of the console.
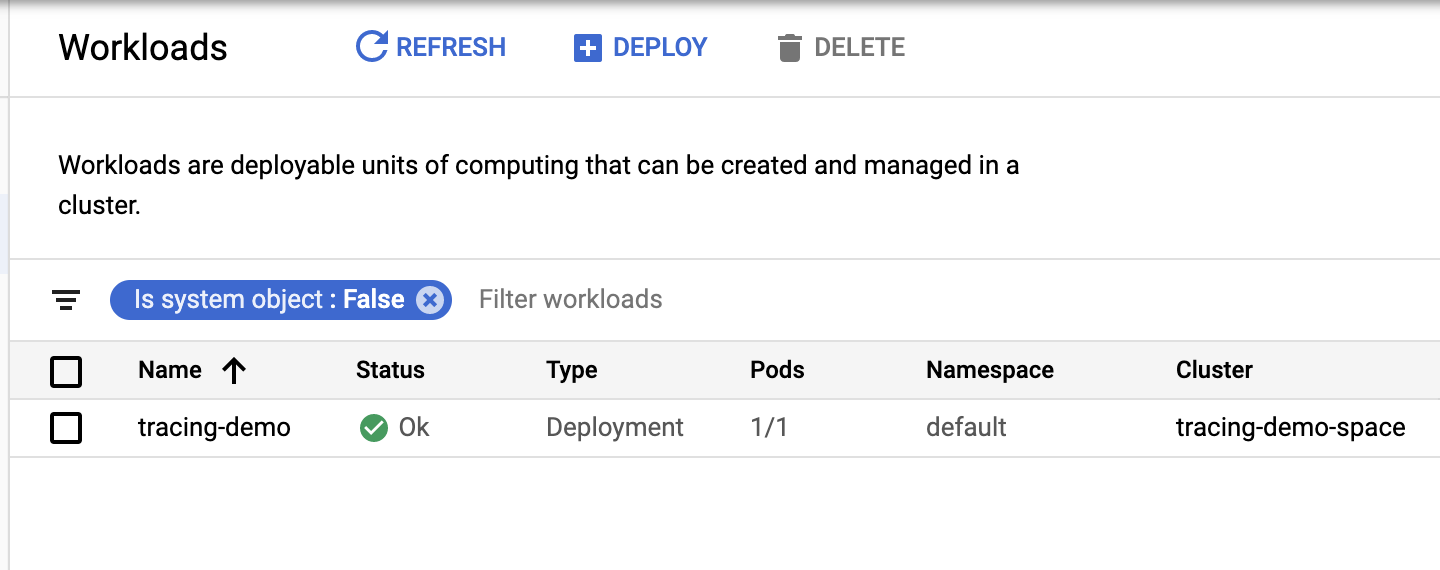
It may take a few minutes for the application to be deployed—if your workloads console resembles the following with a status of "Does not have minimum availability":
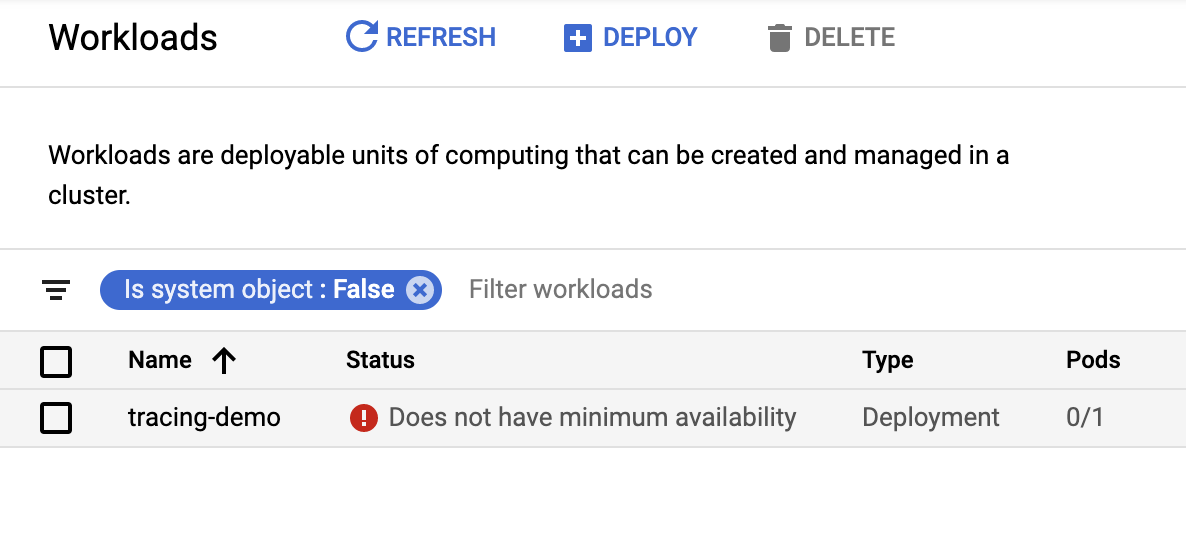
- Refresh the page until you see an "OK" in the status bar:
Incidentally, the endpoint can be programmatically acquired using the following command:
echo http://$(kubectl get svc tracing-demo -n default -o jsonpath='{.status.loadBalancer.ingress[0].ip}')
Copied!
Test completed task
Click Check my progress to verify your performed task. If you have successfully deployed demo application, you will see an assessment score.
Deploy demo application
Task 4. Validation
Generating telemetry data
Once the demo application is deployed, you should see a list of your exposed services.
- Still in the Kubernetes window, under Gateways, Services & Ingress click on Services to view the exposed services.
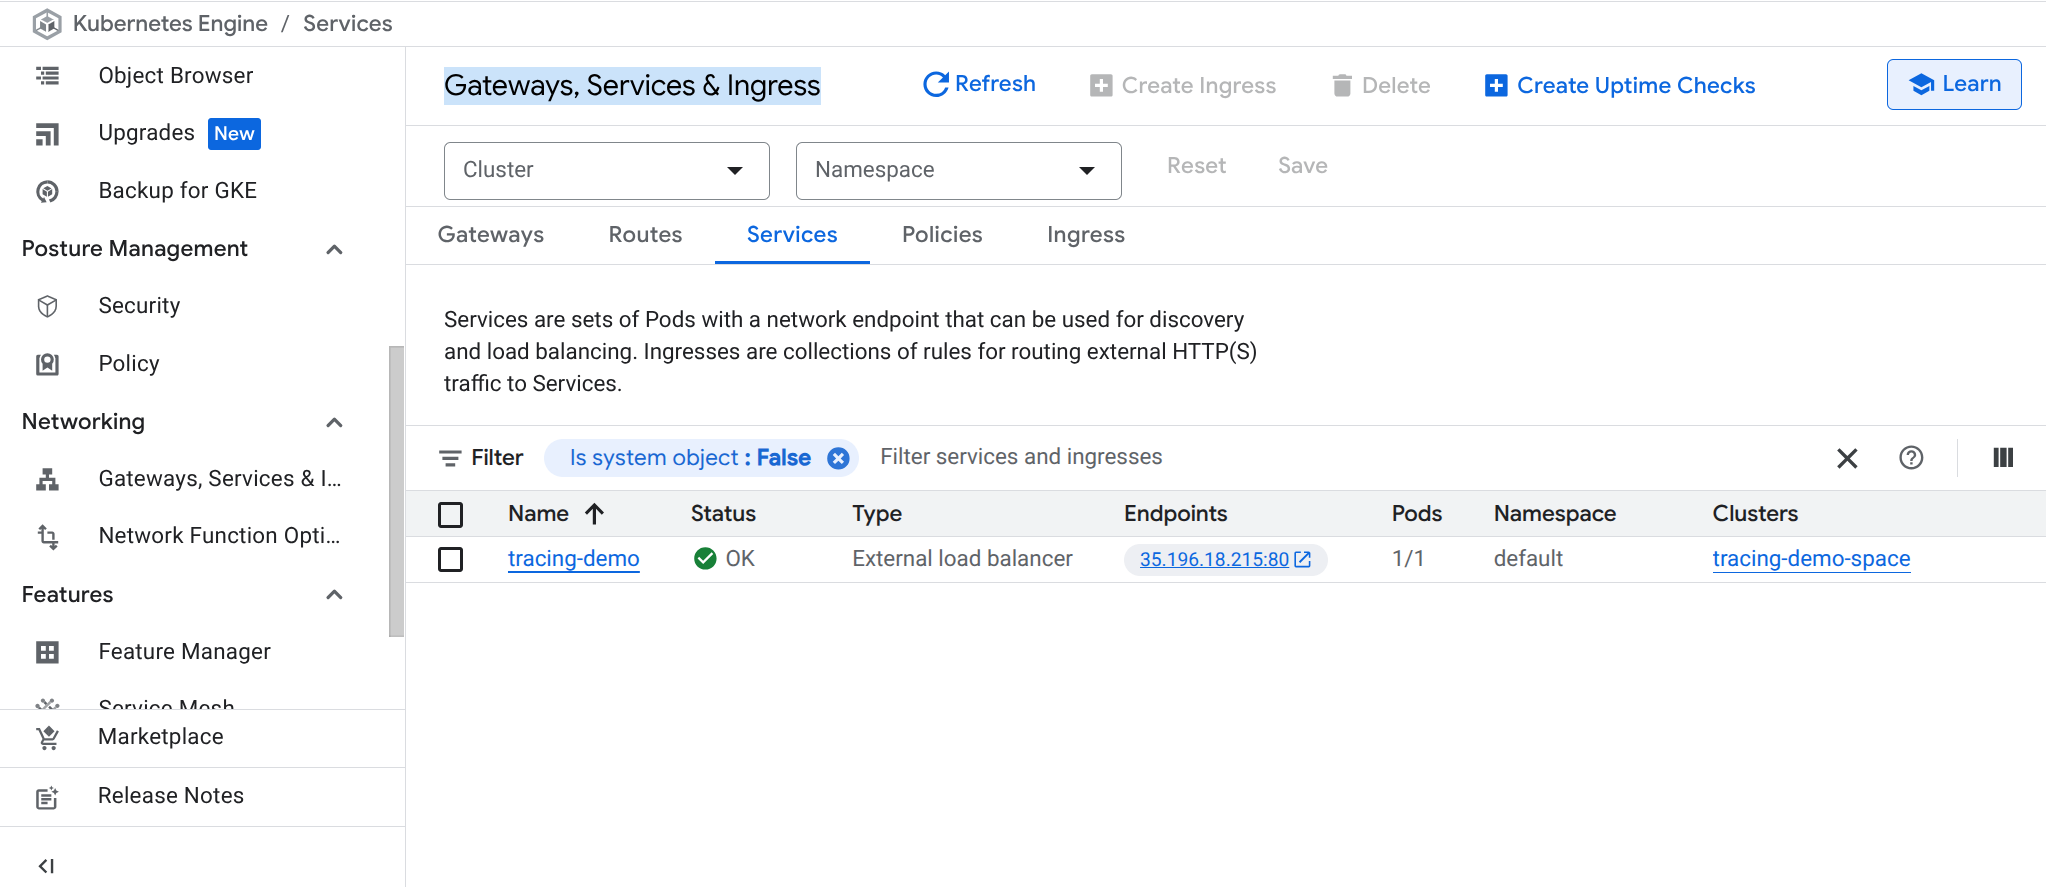
- Click on the endpoint listed next to the
tracing-demoload balancer to open the demo app web page in a new tab of your browser.
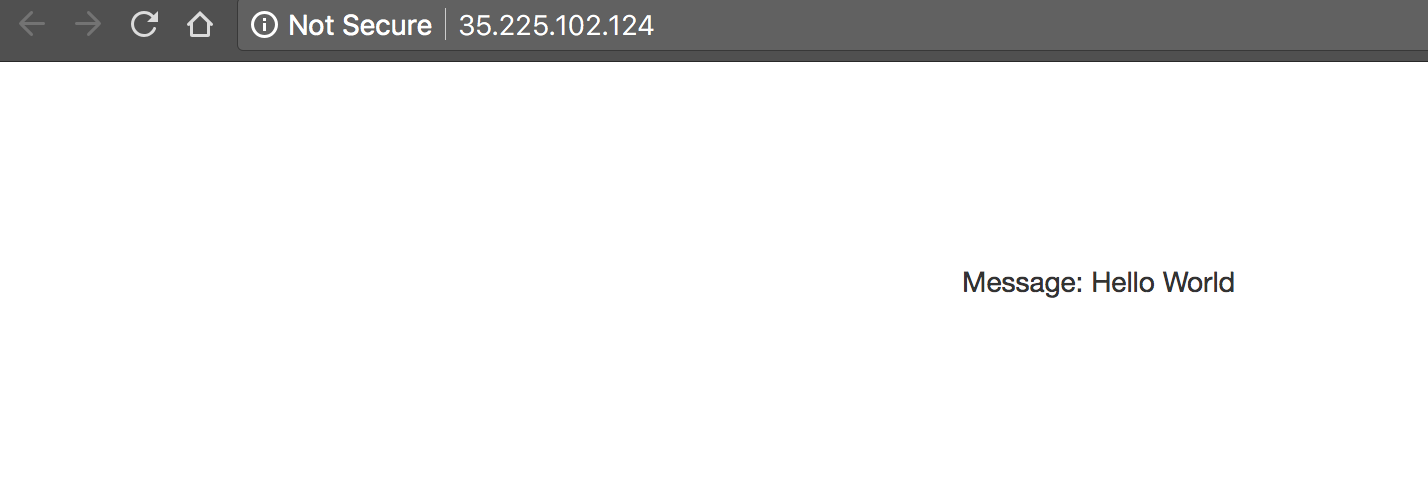
Note that your IP address will likely be different from the example above. The page displayed is simple:
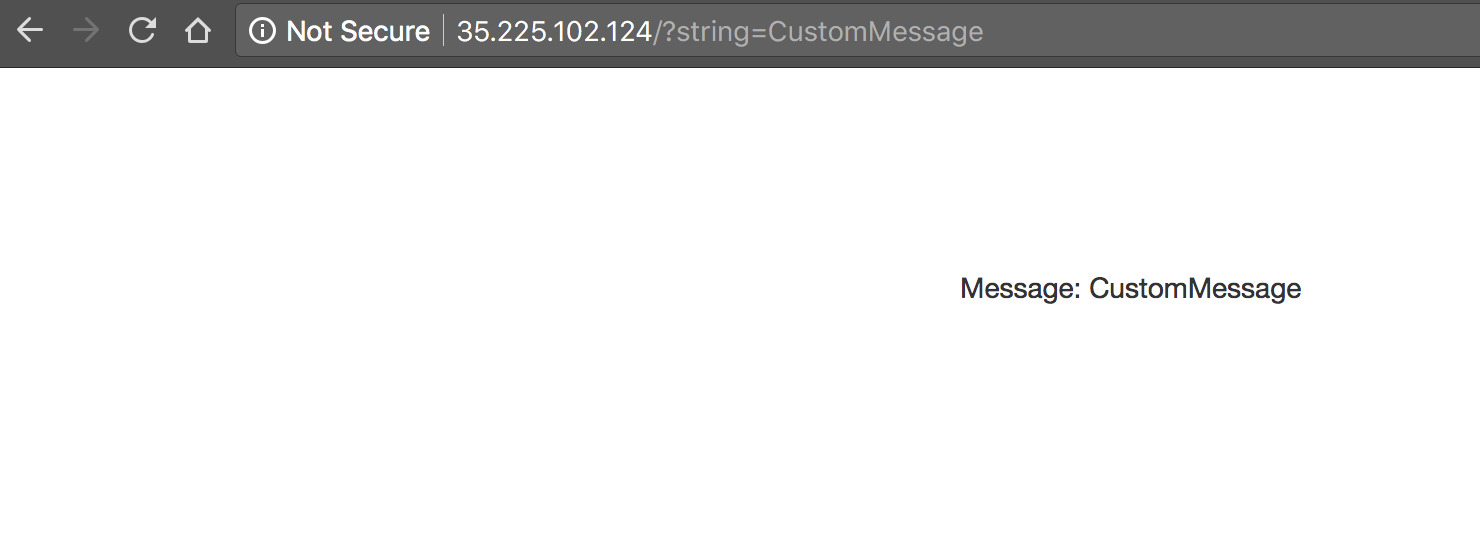
- To the url, add the string:
?string=CustomMessageand see that the message is displayed:
As you can see, if a string parameter is not provided it uses a default value of Hello World. The app is used to generate trace telemetry data.
- Replace "CustomMessage" with your own messages to generate some data to look at.
Test completed task
Click Check my progress to verify your performed task. If you have successfully generated telemetry data, you will see an assessment score.
Generate Telemetry Data
Examining traces
In the Console, select Navigation menu >View all products > scroll to Observability section and click on Trace > Trace explorer. You should see a chart displaying trace events plotted on a timeline with latency as the vertical metric.
If not, click the Auto Run toggle button to see the most up to date data.
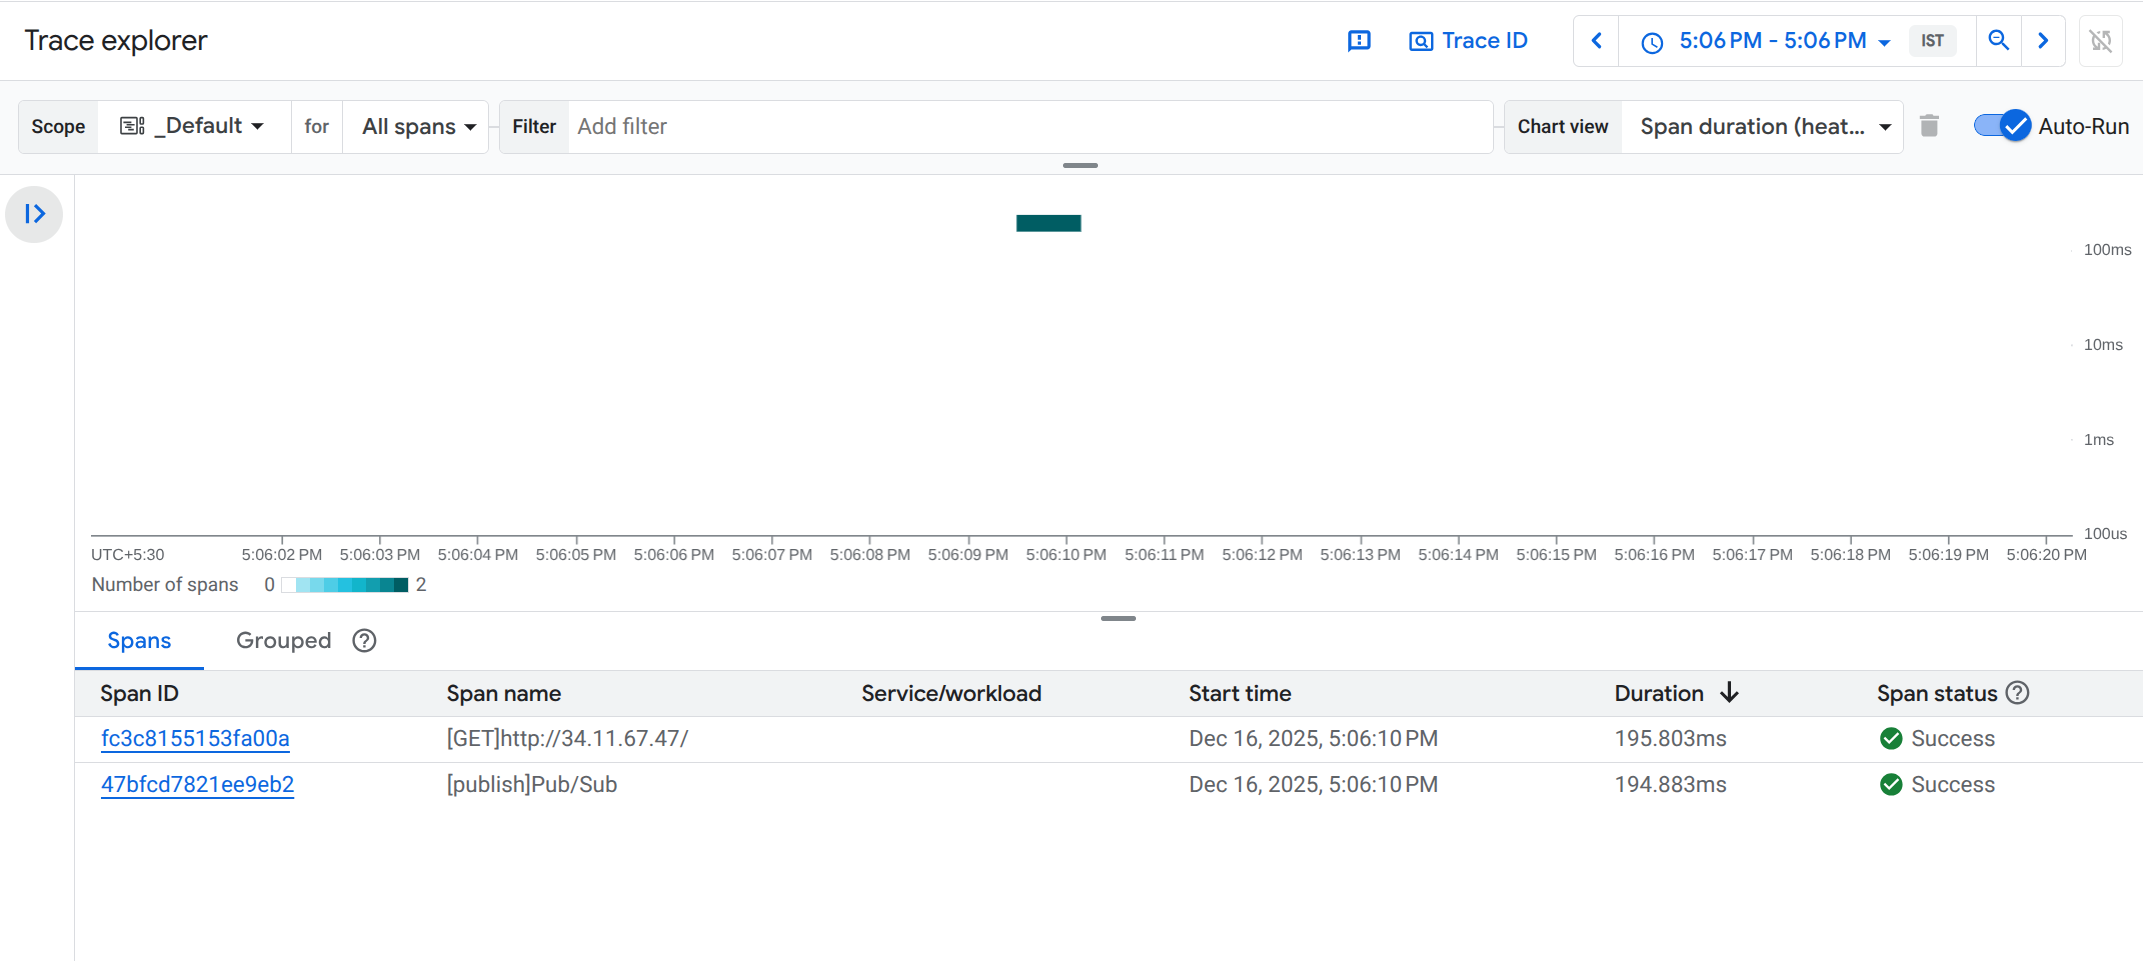
- Click on the dark block in the top graph is a "Heatmap" view, which shows the density of spans occurring at that specific duration and time.
The top entry in the list is known as the root span and represents the duration of the HTTP request, from the moment the first byte arrives until the moment the last byte of the response is sent. The bottom entry in the list represents the duration of the request made when sending the message to the Pub/Sub topic.
Since the handling of the HTTP request is blocked by the call to the Pub/Sub API it is clear that the vast majority of the time spent within the HTTP request is taken up by the Pub/Sub interaction. This demonstrates that by instrumenting each tier of your application you can easily identify where the bottlenecks are.
Pulling Pub/Sub messages
As described in the Architecture section of this document, messages from the demo app are published to a Pub/Sub topic.
These messages can be consumed from the topic using the gcloud CLI:
gcloud pubsub subscriptions pull --auto-ack --limit 10 tracing-demo-cli
Copied!
Output:
DATA: Hello World
MESSAGE_ID: 4117341758575424
ORDERING_KEY:
ATTRIBUTES:
DELIVERY_ATTEMPT:

DATA: CustomMessage
MESSAGE_ID: 4117243358956897
ORDERING_KEY:
ATTRIBUTES:
DELIVERY_ATTEMPT:
Pulling the messages from the topic has no impact on tracing. This section simply provides a consumer of the messages for verification purposes.
Monitoring and logging
Cloud monitoring and logging are not the subject of this demo, but it is worth noting that the application you deployed will publish logs to Cloud Logging and metrics to worth noting that the application you deployed will publish logs to Logging and metrics to Cloud Monitoring
In the Console, select Navigation menu > Monitoring > Metrics Explorer.
In the Select a metric field, select VM Instance > Instance > CPU Usage then click Apply.
You should see a chart of this metric plotted for different pods running in the cluster.
To see logs, select Navigation menu > View all products scroll to Observability section and click on Logging.
In Log fields section, set the following:
RESOURCE TYPE:
Kubernetes ContainerCLUSTER NAME:
tracing-demo-spaceNAMESPACE NAME:
default
Task 5. Troubleshooting in your own environment
Several possible errors can be diagnosed using the kubectl command. For instance, a deployment can be shown:
kubectl get deployment tracing-demo
Copied!
Output:
NAME           READY   UP-TO-DATE   AVAILABLE   AGE
tracing-demo   1/1     1            1           21m
More details can be shown with describe:
kubectl describe deployment tracing-demo
Copied!
This command will show a list of deployed pods:
kubectl get pod
Copied!
Output:
NAME                            READY     STATUS    RESTARTS   AGE
tracing-demo-59cc7988fc-h5w27   1/1       Running   0          23m
Again, details of the pod can be seen with describe:
kubectl describe pod tracing-demo
Copied!
Note the pod Name to use in the next step.
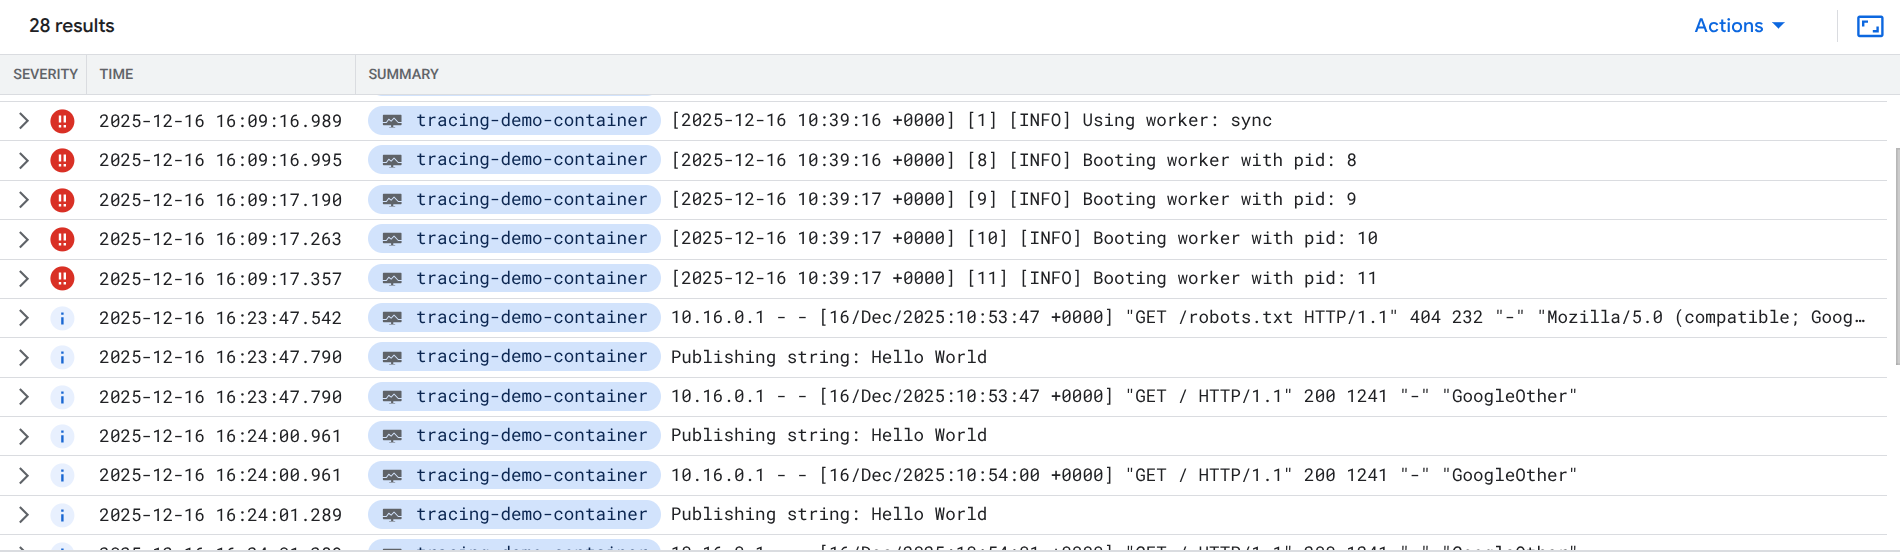
Once you know the pod name, use the name to view logs locally:
kubectl logs <LOG_NAME>
Copied!
Output:
10.60.0.1 - - [22/Jun/2018:19:42:23 +0000] "HEAD / HTTP/1.0" 200 - "-" "-"
Publishing string: Hello World
10.60.0.1 - - [22/Jun/2018:19:42:23 +0000] "GET / HTTP/1.1" 200 669 "-" "Mozilla/5.0 (Windows NT 10.0; WOW64) AppleWebKit/537.36 (KHTML, like Gecko) Chrome/51.0.2704.103 Safari/537.36"
The install script fails with a Permission denied when running Terraform. The credentials that Terraform is using do not provide the necessary permissions to create resources in the selected projects. Ensure that the account listed in gcloud config list has necessary permissions to create resources. If it does, regenerate the application default credentials using gcloud auth application-default login.
Task 6. Teardown
- Qwiklabs will take care of shutting down all the resources used for this lab, but here’s what you would need to do to clean up your own environment to save on cost and to be a good cloud citizen:
terraform destroy
Copied!
As with apply, Terraform will prompt for a yes to confirm your intent.
Since Terraform tracks the resources it created it can tear down the cluster, the Pub/Sub topic, and the Pub/Sub subscription.
Note: If you get deprecation warnings related to the zone variable, ignore it.
Solution of Lab
Quick
curl -LO raw.githubusercontent.com/ePlus-DEV/storage/refs/heads/main/labs/GSP484/lab.sh
source lab.sh