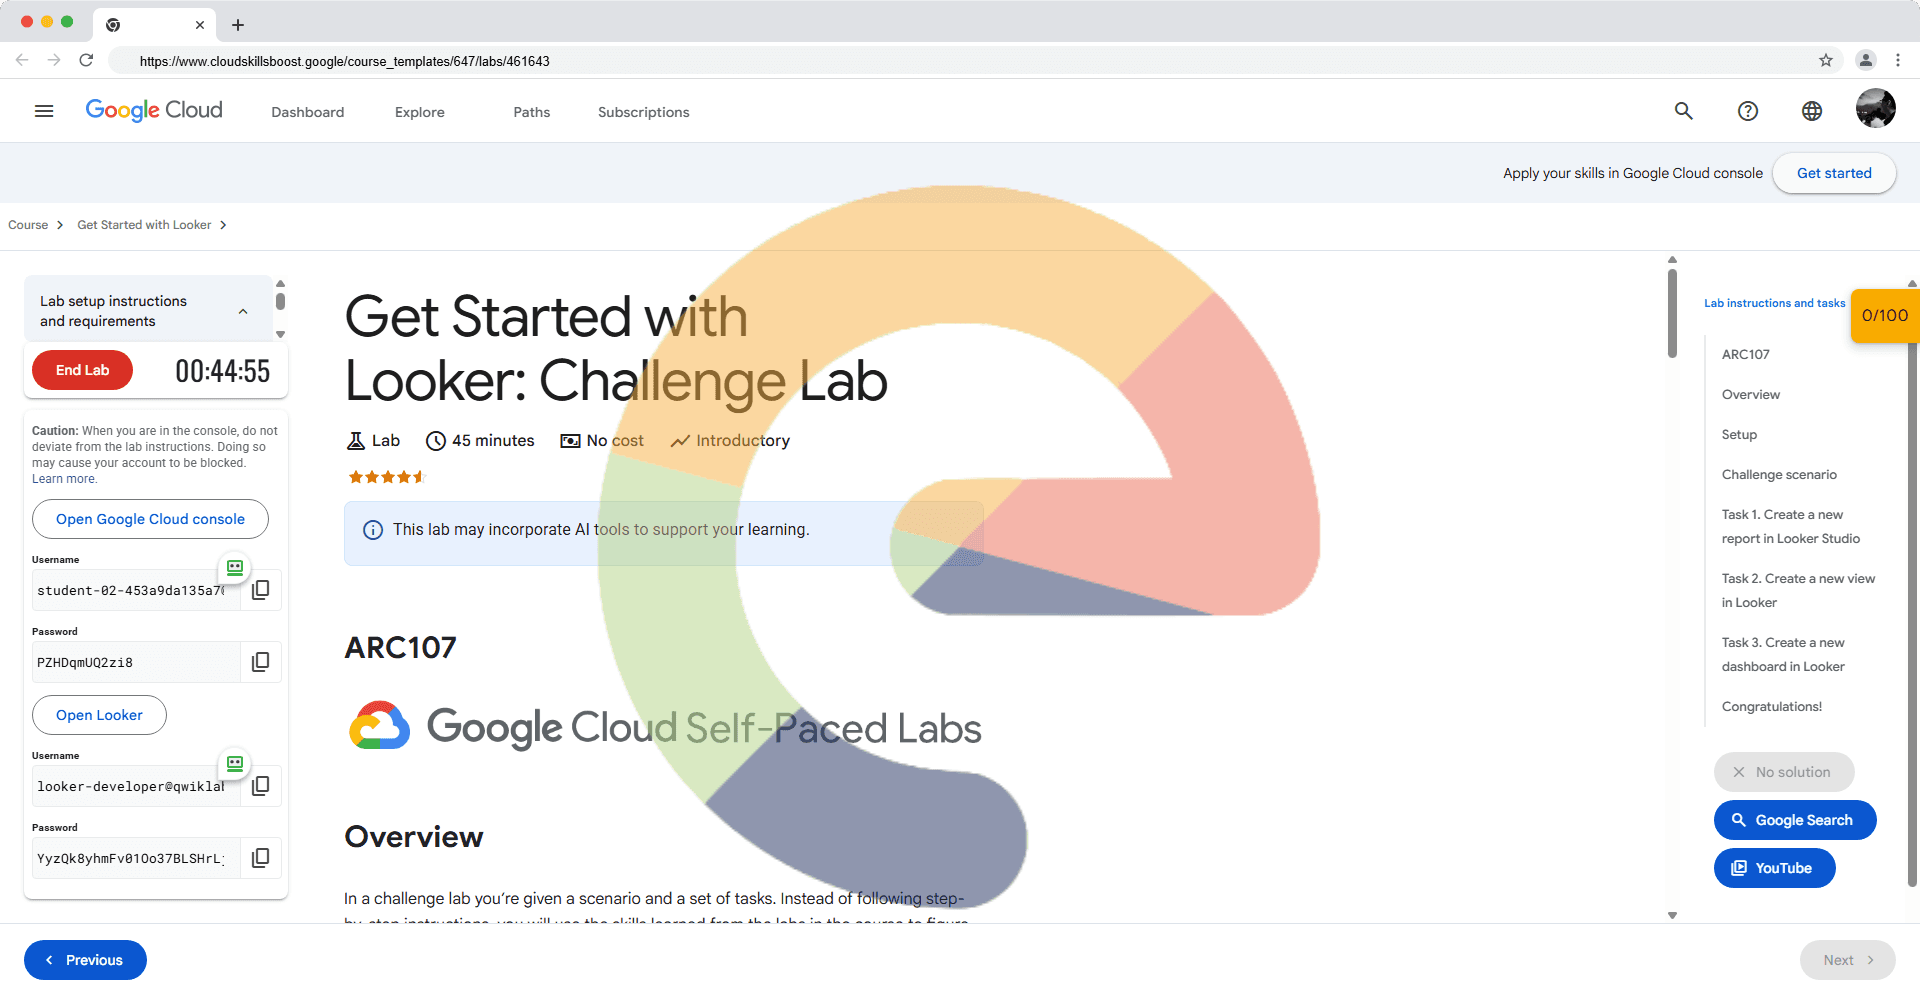
Get Started with Looker: Challenge Lab - ARC107
A passionate full-stack developer from @ePlus.DEV
Overview
In a challenge lab you’re given a scenario and a set of tasks. Instead of following step-by-step instructions, you will use the skills learned from the labs in the course to figure out how to complete the tasks on your own! An automated scoring system (shown on this page) will provide feedback on whether you have completed your tasks correctly.
When you take a challenge lab, you will not be taught new Google Cloud concepts. You are expected to extend your learned skills, like changing default values and reading and researching error messages to fix your own mistakes.
To score 100% you must successfully complete all tasks within the time period!
Setup
Before you click the Start Lab button
Read these instructions. Labs are timed and you cannot pause them. The timer, which starts when you click Start Lab, shows how long Google Cloud resources will be made available to you.
This hands-on lab lets you do the lab activities yourself in a real cloud environment, not in a simulation or demo environment. It does so by giving you new, temporary credentials that you use to sign in and access Google Cloud for the duration of the lab.
To complete this lab, you need:
- Access to a standard internet browser (Chrome browser recommended).
Note: Use an Incognito or private browser window to run this lab. This prevents any conflicts between your personal account and the Student account, which may cause extra charges incurred to your personal account.
- Time to complete the lab---remember, once you start, you cannot pause a lab.
Note: If you already have your own personal Google Cloud account or project, do not use it for this lab to avoid extra charges to your account.
Challenge scenario
You are just starting your junior data analyst role. So far you have been helping teams analyze and visualize data using Looker Studio and Looker.
You are expected to have the skills and knowledge for these tasks.
Your challenge
You are asked to help a newly formed development team with some of their initial work on a new project around analyzing and visualizing online sales data. You have been asked to assist the Sales team with their analysis in both Looker Studio and Looker; you receive the following request to complete the following tasks:
Create a report of BigQuery public data in Looker Studio.
Create a new view and join it to an existing Explore in Looker.
Create a new dashboard in Looker.
Each task is described in detail below, good luck!
Task 1. Create a new report in Looker Studio
Create a new Looker Studio report named Online Sales, and connect to Public datasets >
qwiklabs-gcp-03-32e4ec77b489> thelook_ecommerce > orders.Add a time series chart using any theme and title of your choice.
Click Check my progress to verify the objective.
Create a new BigQuery data source in Looker Studio
Task 2. Create a new view in Looker
- Create a new view named users_region with the following specifications:
Use the source table named
cloud-training-demos.looker_ecomm.users.Include the following dimensions:
id as a primary key using the
numbertype and the following sql reference:${TABLE}.idstate using the
stringtype and the following sql reference:${TABLE}.statecountry using the
stringtype and the following sql reference:${TABLE}.country
Include the following measure:
- count with drill_fields that includes only the dimensions that you have included in the new view
Join the new view to the existing Events Explore.
Deploy your changes to production.
Click Check my progress to verify the objective.
Create a new view and join it to a Looker Explore
Task 3. Create a new dashboard in Looker
Use your new view named users_region to create a bar chart of the top 3 event types based on the highest number of users.
Customize your bar chart using any colors and labels of your choice.
Save your bar chart to a new dashboard named User Events.
Click Check my progress to verify the objective.
Create a new dashboard in Looker
Solution of Lab
Quick
🧠 Task 1: Create a New Report in Looker Studio
Create a report named Online Sales and visualize order data from BigQuery.
Public datasets > PROJECT-ID > thelook_ecommerce > orders

Online Sales

✅Development Mode → qwiklabs-ecommerce
Create a new view named users_region and paste the following:
view: users_region {
  sql_table_name: cloud-training-demos.looker_ecomm.users ;;

  dimension: id {
    type: number
    sql: ${TABLE}.id ;;
    primary_key: yes
  }

  dimension: state {
    type: string
    sql: ${TABLE}.state ;;
  }

  dimension: country {
    type: string
    sql: ${TABLE}.country ;;
  }

  measure: count {
    type: count
    drill_fields: [id, state, country]
  }
}
Replace the following in training_ecommerce.model file:
connection: "bigquery_public_data_looker"

# include all the views
include: "/views/*.view"
include: "/z_tests/*.lkml"
include: "/**/*.dashboard"

datagroup: training_ecommerce_default_datagroup {
  # sql_trigger: SELECT MAX(id) FROM etl_log;;
  max_cache_age: "1 hour"
}

persist_with: training_ecommerce_default_datagroup

label: "E-Commerce Training"

explore: order_items {
  join: users {
    type: left_outer
    sql_on: ${order_items.user_id} = ${users.id} ;;
    relationship: many_to_one
  }

  join: inventory_items {
    type: left_outer
    sql_on: ${order_items.inventory_item_id} = ${inventory_items.id} ;;
    relationship: many_to_one
  }

  join: products {
    type: left_outer
    sql_on: ${inventory_items.product_id} = ${products.id} ;;
    relationship: many_to_one
  }

  join: distribution_centers {
    type: left_outer
    sql_on: ${products.distribution_center_id} = ${distribution_centers.id} ;;
    relationship: many_to_one
  }
}

explore: events {
  join: event_session_facts {
    type: left_outer
    sql_on: ${events.session_id} = ${event_session_facts.session_id} ;;
    relationship: many_to_one
  }
  join: event_session_funnel {
    type: left_outer
    sql_on: ${events.session_id} = ${event_session_funnel.session_id} ;;
    relationship: many_to_one
  }
  join: users {
    type: left_outer
    sql_on: ${events.user_id} = ${users.id} ;;
    relationship: many_to_one
  }
  join: users_region {
    type: left_outer
    sql_on: ${events.user_id} = ${users_region.id};;
    relationship: many_to_one
  }
}
Task 3:

Click Save → Save as a Look.
- Name it:
Top 3 Event Types
- Name it:
Then click Save to Dashboard → Create New Dashboard.
- Name the dashboard: User Events
Click Save.

Manual
🧠 Task 1: Create a New Report in Looker Studio
🎯 Goal
Create a report named Online Sales and visualize order data from BigQuery.
1. Create a new Looker Studio report
Go to Looker Studio.
Click “+ Blank Report”.
Name it Online Sales.
2. Connect to BigQuery public dataset
Click “Add data” → BigQuery.
Navigate to:
Public datasets > qwiklabs-gcp-01-15e3b0e540a4 > thelook_ecommerce > ordersClick Connect → Add to Report.
3. Add a Time Series chart
Click “Add a chart” → “Time series”.
Set:
Dimension:
created_at(ordate)Metric:
total_amountororder_count
Customize the title and theme (any style you like).
Click Save.
✅ Result: A report named Online Sales with a time series chart from BigQuery.
🧠 Task 2: Create a New View in Looker
🎯 Goal
Create a new view users_region and join it with the existing events Explore.
1. Create a new view file
In Looker Develop mode, go to the
views/folder.Create a new file named:
users_region.view.lkml.
📄 Paste this LookML:
view: users_region {
  sql_table_name: cloud-training-demos.looker_ecomm.users ;;

  dimension: id {
    primary_key: yes
    type: number
    sql: ${TABLE}.id ;;
  }

  dimension: state {
    type: string
    sql: ${TABLE}.state ;;
  }

  dimension: country {
    type: string
    sql: ${TABLE}.country ;;
  }

  measure: count {
    type: count
    drill_fields: [id, state, country]
  }
}
2. Join the view to events Explore
Open
events.explore.lkml.Add the following join:
explore: events {
  join: users_region {
    type: left_outer
    sql_on: ${events.user_id} = ${users_region.id} ;;
    relationship: many_to_one
  }
}
3. Deploy to production
Click Validate LookML → fix any errors if shown.
Click Deploy to Production to publish the changes.
✅ Result: New view users_region is created and successfully joined with events.
🧠 Task 3: Create a New Dashboard in Looker
🎯 Goal
Create a dashboard User Events with a bar chart showing the top 3 event types with the highest number of users.
1. Go to Explore
In Looker, click Explore.
Select the Explore that includes the
users_regionjoin (usuallyevents).
2. Build the query
Under Dimensions, select:
events.event_type
Under Measures, select:
users_region.count(number of users per event type)
Sort: by
users_region.countdescending.Limit: set 3 rows (top 3 event types).
3. Create the visualization
Click the Visualization tab.
Choose Bar Chart.
Customize:
Title: “Top 3 Event Types by User Count”
X-Axis: Event Type
Y-Axis: Number of Users
Pick any color scheme.
Enable data labels.
4. Save to a new dashboard
Click Save → Save as a Look.
- Name it:
Top 3 Event Types
- Name it:
Then click Save to Dashboard → Create New Dashboard.
- Name the dashboard: User Events
Click Save.
✅ Result: A new dashboard User Events containing a bar chart showing the top 3 event types with the highest number of users.
📋 Final Verification Checklist
| Task | What to Check | Status |
| 1 | Report Online Sales created in Looker Studio with a time series chart | ✅ |
| 2 | View users_region created, joined to events, and deployed | ✅ |
| 3 | Dashboard User Events created with bar chart (Top 3 event types by users) | ✅ |